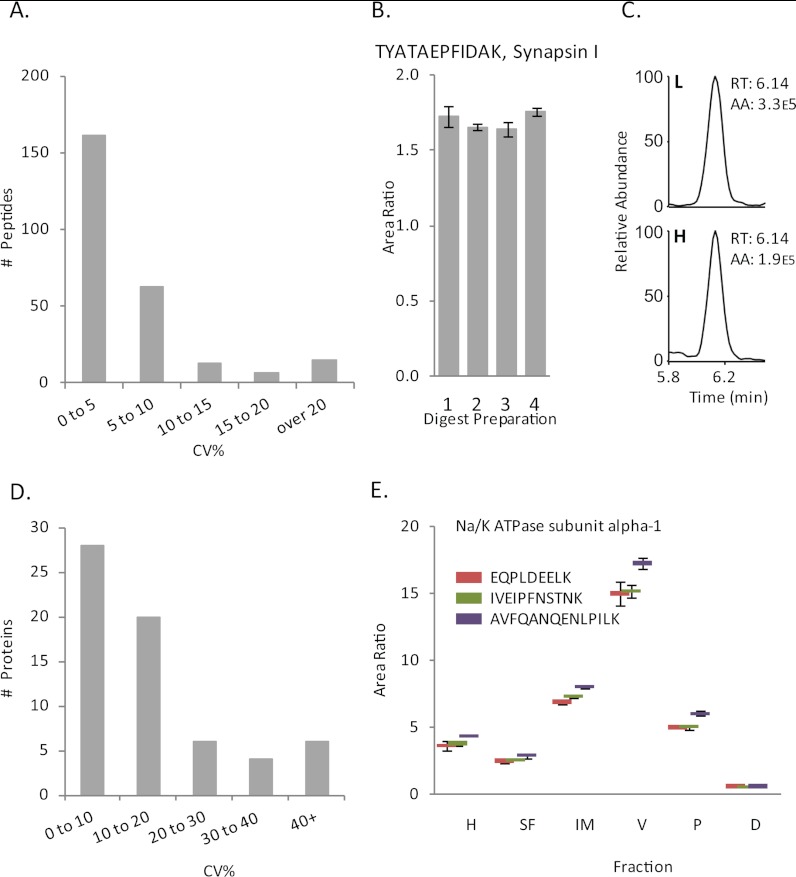
Fig. 2.
Precision of peptide quantification. To assess variability in sample preparation, four 30 μg aliquots of a human intermediate membrane fraction were individually mixed with 15 μg [13C6]brain ISTD and analyzed by LC-SRM/MS with triplicate injections. The coefficient of variance expressed as percentage (CV%) was calculated for each peptide measured across the four fractions. A, Depicts the distribution of the peptide CV%s, showing the vast majority under 10%. B, Shows light/heavy area ratios for the TYATAEPFIDAK peptide, which is unique to Synapsin I. Error bars are standard deviation of the triplicate injections. C, Chromatographic peaks from LC-SRM/MS analysis of TYATAEPFIDAK. CV% of peptide measures for the same proteins were calculated to assess accuracy of protein measures derived from multiple peptide SRMs. D, Shows the distribution of these CV%s. E, shows the consistency of peptide measures for the same protein (Na/K ATPase subunit alpha-1) across six fractions prepared from human subject 1.

