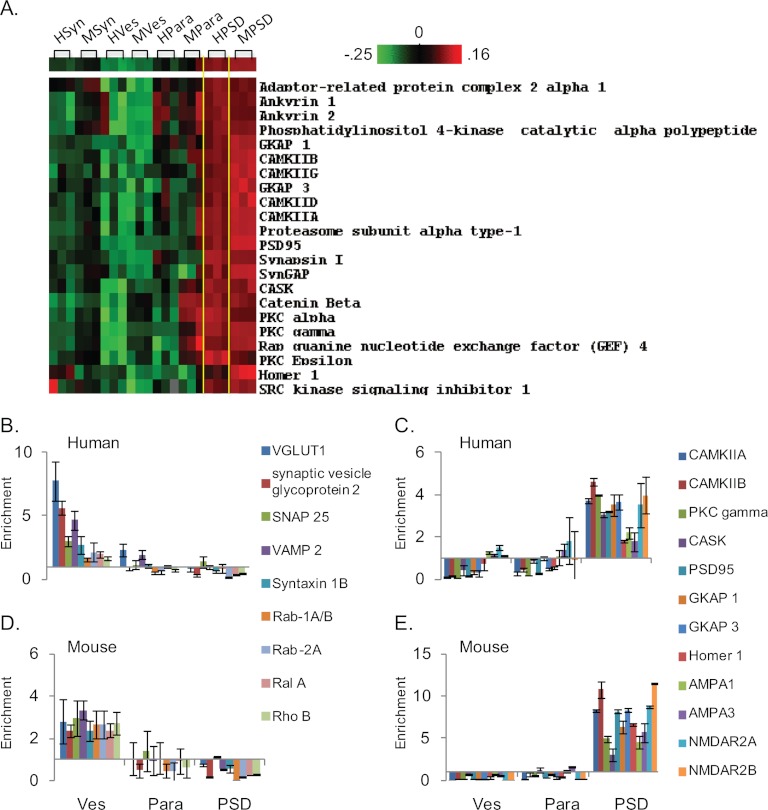
Fig. 4.
Comparison of human and mouse vesicular and postsynaptic density fractions. A, rotated and expanded view of Fig. 3B showing protein enrichment in PSD fractions prepared from human and mouse tissues. The Pearson's Correlation Coefficient for this grouping was 0.72. To more closely contrast human and mouse fractions we compared enrichment values for a subset of the proteins grouped in the clustering analysis. B and D, Show the enrichment of vesicular proteins in vesicular (Ves), parasynaptic (Para), and PSD fractions from human and mouse tissues. C and E, Show enrichment of kinases, scaffolding proteins, and glutamate receptors in the same fractions from humans and mice. Error bars are standard deviation of three individuals/animals. Note that in C and E, protein enrichment is higher in the fractions prepared from mouse tissue.

