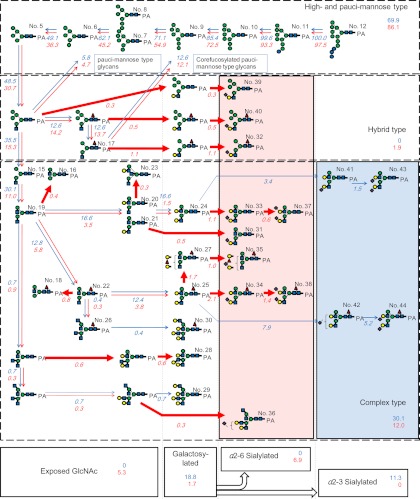
Fig. 4.
A glycome “grand map” covering presumed biosynthetic pathways of N-linked glycans produced in iPSCs and SCs. Glycan numbers (1–44) correspond to those defined in Table I. The map is constructed based on the generally accepted biosynthetic pathways of N-linked glycans (30). Red and blue arrows indicate biosynthetic reactions depicted in iPSCs and SCs, respectively. Estimated percentages of respective biosynthetic reactions are shown in italicized figures near the arrows, where the starting precursor Man9Glc3GlcNAc2 (No. 12, 100%) is taken as 100%. Quantitative data are from Table I. Thick arrows indicate specific reactions exclusively detected in iPSCs. The following monosaccharide symbols are used to express glycan structures: green circle, Man; blue square, GlcNAc; yellow circle, Gal; blue circle, Glc; red triangle, Fuc; violet diamond, NeuAc.

