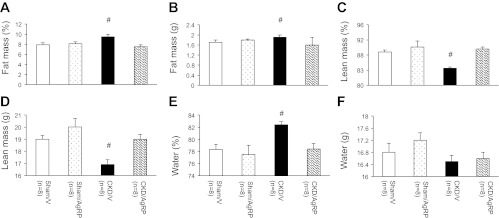
Fig. 3.
Body composition analysis of postmortem mice by QMR. At the end of study, 8 mice from all groups were scanned by QMR to determine the percentage of fat mass (A), total fat mass (B), percentage of lean mass (C), total lean mass (D), percentage of water content (E), and total water mass (F). Final results are means ± SE. Sham/AgRP, CKD/V, and CKD/AgRP mice were compared with Sham/V mice. #P < 0.001.

