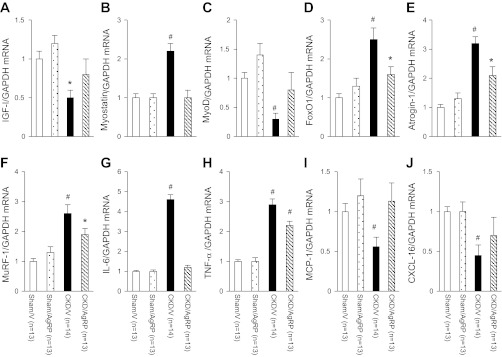
Fig. 6.
Gene expression in gastrocnemius muscle. Comparative 2−ΔΔCt method was used to determine the relative quantification of IGF-I (A), myostatin (B), MyoD (C), FoxO1 (D), Atrogin-1 (E), MuRF-1 (F), IL-6 (G), TNF-α (H), MCP-1 (I), and CXCL-16 (J) mRNA content. To normalize each sample for RNA content, the control gene GAPDH was used. Relative quantification of target gene was related to the PCR signal of the specific transcript of Sham/V mice. Final results were expressed in arbitrary units, with 1 unit being the mean mRNA level determined in the Sham/V control mice. Data are means ± SE. #P < 0.01. *P < 0.05.

