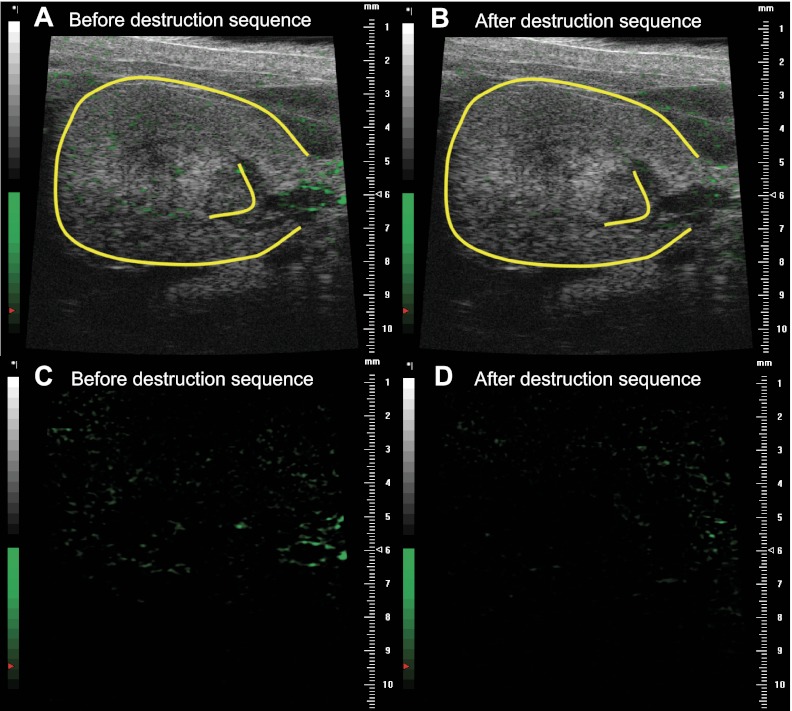
Fig. 2.
Representative contrast-mode ultrasound image of a postischemic kidney (outlined in yellow) before (A and C) and after (B and D) application of the destruction sequence. In all images, the circulating contrast agent has been subtracted, thus showing adherent contrast agent only. Images are shown both in gray scale (A and B) and green scale, depicting adherent contrast agent only (C and D).

