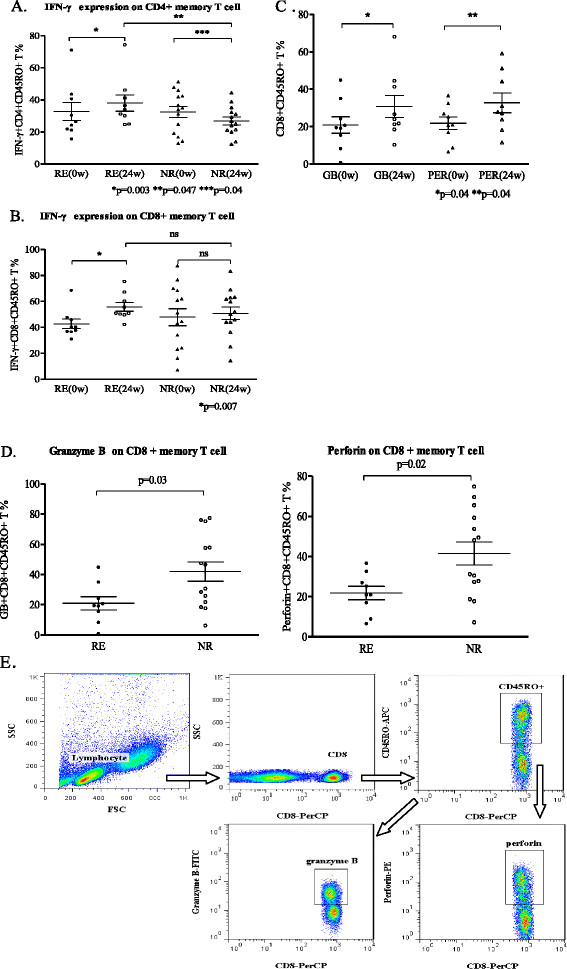
Figure 2.

Distributions of different effector molecules expression on memory T cells. (A) Percentages of IFN-γ expression on CD4 memory T cell between the responders (RE) and the non-responders (NR), which represented the effector molecule of Th1 subsets. (B) Percentages of IFN-γ expression on CD8 memory T cells between the responders and the non-responders, which represented the effector molecule of cytotoxic T cells. (C) Percentages of granzyme B and perforin expression on CD8 memory T cells comparison in the responders at week 0 and week 24. (D) Percentages of granzyme B and perforin expression on CD8 memory T cells between the responders and the non-responders at week 24. (E) Gating strategy in analysis of granzyme B and perforin expression on CD8 memory T cells by ICCS.
