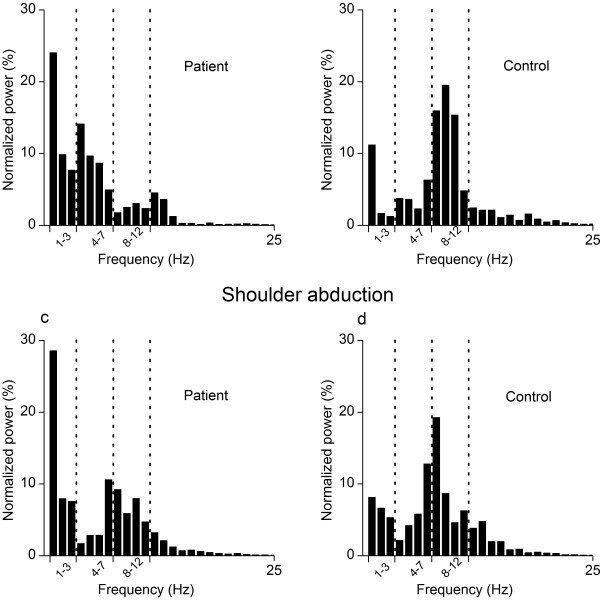
Figure 4.
Example of the distribution of normalized power of acceleration. The power distribution is shown during unloaded elbow flexion (a, b) and shoulder abduction (c, d) for one fibromyalgia patient (a, c) and one healthy control (b, d). Bars indicate mean normalized power within bins of 1 Hz while dotted vertical lines denote the frequency bands 1–3 Hz, 4–7 Hz, and 8–12 Hz.

