Figure 2.
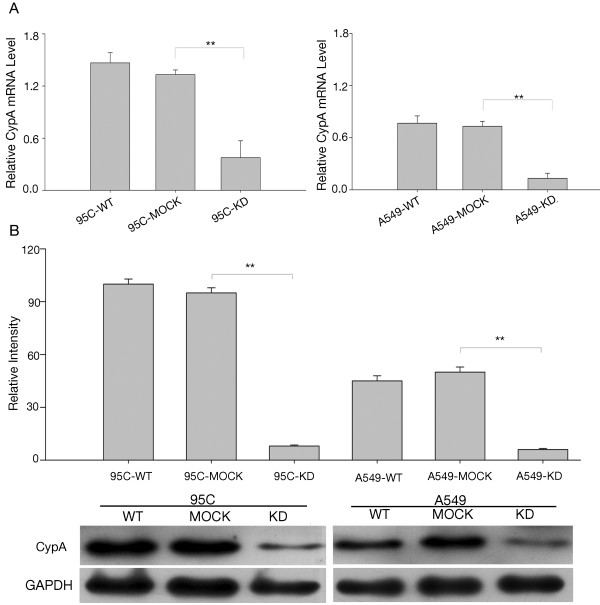
Interference with CypA expression in 95C and A549 cells. A, CypA mRNA expression in 95C and A549 cells with CypA-targeting RNAi. The relative mRNA level is presented as 2-ΔCT. The data are the means ± SEM of three separate experiments. B, CypA protein levels in 95C and A549 cells with CypA-targeting RNAi. Cell lysates prepared from each group were screened using Western blotting with anti-CypA antibodies. The data are expressed as the mean ± SEM of triplicate values from three separate experiments. **P<0.01 (t-test).

