Figure 2.
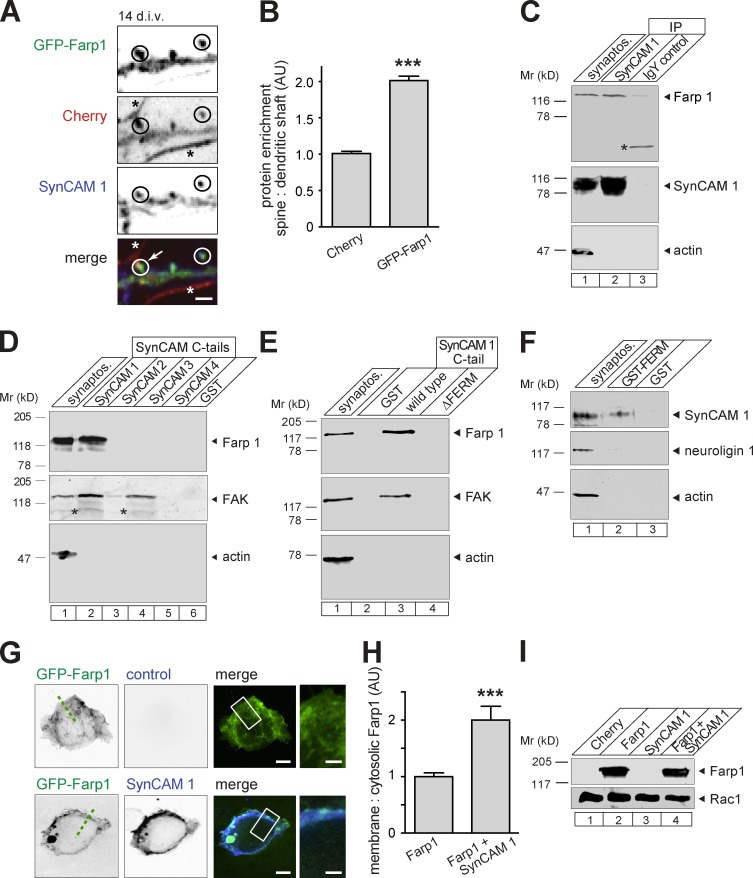
SynCAM 1 forms a synaptic complex with Farp1 and recruits it to membranes. (A and B) GFP-Farp1 colocalizes with SynCAM 1 at dendritic protrusions. (A) Confocal image of dendrites from neurons coexpressing GFP-Farp1 (green) and Cherry (red). Neurons were stained at 14 div for endogenous, surface-expressed SynCAM 1 (blue). Circles mark colocalization at spine protrusions. Asterisks label Farp1-negative neurites that are probably axons based on narrowness and length. The arrow indicates a likely en passant synapse with a Farp1-positive spine. Bar, 1 µm. (B) GFP-Farp1 is enriched in spines by 100 ± 6.8% relative to Cherry measured from images as in A (99 spines/condition; three independent experiments; P < 0.0001; error bars indicate mean ± SEM). (C) Farp1 coimmunoprecipitates with SynCAM 1 from rat forebrain synaptosomes at P13. IgY was a control for antibody specificity, and actin was a negative control for binding. The asterisk marks an unidentified, cross-reactive protein. (D) Synaptosomal Farp1 is retained by a GST fusion of the SynCAM 1 cytosolic tail, but not other SynCAMs. FAK and actin served as positive and negative controls for binding. The asterisks mark unidentified bands. (E) Binding of Farp1 extracted from synaptosomes at P13 to the cytosolic tail of SynCAM 1 requires the SynCAM 1 FERM-binding motif. (F) A GST fusion of the Farp1 FERM domain retains SynCAM 1 solubilized from synaptosomes. Neuroligin 1 and actin were negative controls. (G–I) SynCAM 1 recruits GFP-Farp1 to plasma membranes. (G) Confocal images of HEK293 cells expressing GFP-Farp1 alone (green; top) or with SynCAM 1 (blue; bottom). GFP-Farp1 distribution was measured by line scans as indicated by the broken line. Boxed areas are enlarged on the right. Bars: (overview panels) 5 µm; (insets) 2 µm. (H) Quantification of data as in G normalized to cells expressing GFP-Farp1 alone (GFP-Farp1, 39 cells; GFP-Farp1+SynCAM 1, 51; three independent experiments; error bars indicate mean ± SEM; ***, P < 0.001). (I) Farp1 amount in transfected HEK293 cells is unaffected by SynCAM 1. Lysates were immunoblotted for Farp1. Rac1 served as loading control.

