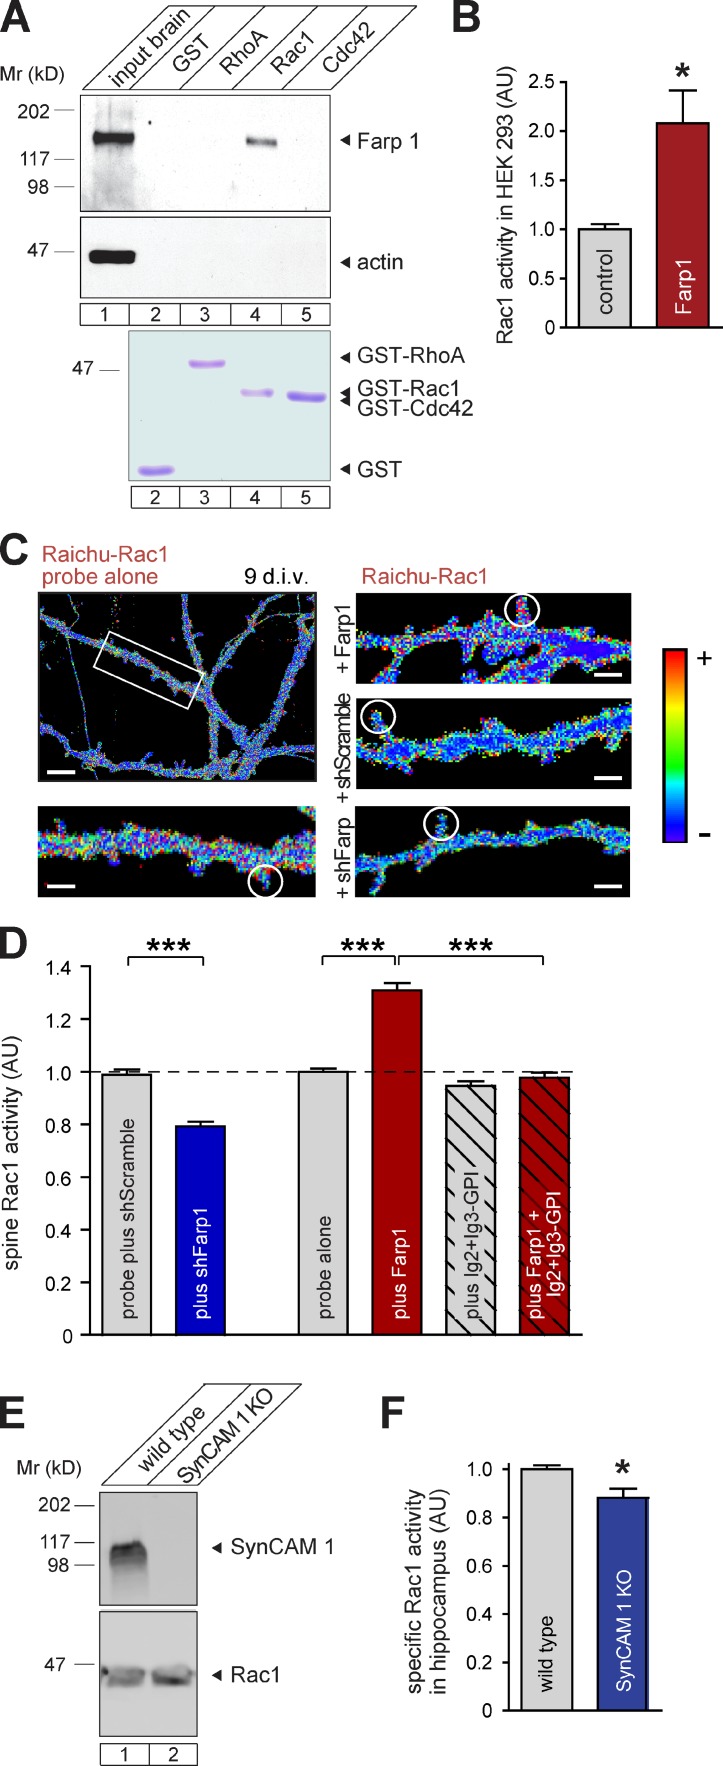
Figure 7.
Farp1 activates postsynaptic Rac1. (A) Farp1 expressed in HEK293 cells binds the Rac1 G15A empty nucleotide mutant but not RhoA G17A or Cdc42 G15A measured by affinity chromatography on GST fusions. Actin was a negative control. Bottom row, comparable amounts of immobilized GST fusion proteins detected by Coomassie staining. (B) Farp1 activates Rac1. HEK293 cells expressing Farp1 contain twice as much active GTP-Rac1 compared with cells expressing Cherry (n = 3 independent experiments). (C and D) Farp1 overexpression increases whereas Farp1 knockdown decreases Rac1 activity in spines. (C) Rac1 activity imaged in live neurons at 9 div with the Raichu-Rac1 probe in dendritic protrusions vs. adjacent shaft areas. Ratiometric heat maps represent a higher YFP/CFP ratio, which is indicative of greater Rac1 activity, as warmer colors. The boxed area in the overview is enlarged below. Circles mark representative dendritic spines. Bars: (overview) 5 µm; (enlarged panel) 1 µm. (D) Quantification of images obtained as in C (probe plus shScramble, n = 149 spines; plus shFarp1, 189; probe alone, 269; plus Farp1, 223; plus Ig2+Ig3-GPI, 259; plus Farp1 + Ig2+Ig3-GPI, 234; three independent experiments). The broken lines mark the control’s value of AU = 1.0, to which the other values were normalized. (E) Same Rac1 levels in WT and SynCAM 1 KO hippocampi by quantitative immunoblotting. (F) Lower Rac1 activity in SynCAM 1 KO hippocampi at P13 than in WT littermates (n = 6 mice each). Specific Rac1 activity was measured by normalizing active GTP-Rac1 levels to Rac1 protein amounts determined by quantitative immunoblotting. Error bars indicate mean ± SEM. *, P < 0.05; ***, P < 0.001.

