Figure 8.
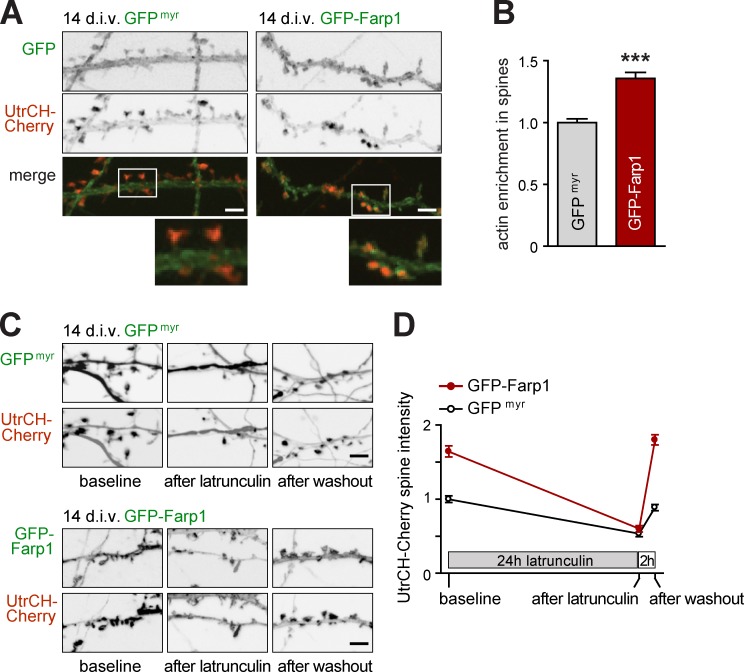
Farp1 promotes F-actin assembly in spines. (A and B) GFP-Farp1 increases F-actin amounts in spine heads. (A) Confocal images of live neurons at 14 div coexpressing the F-actin probe UtrCH-Cherry (red) with GFPmyr (green, left column) or GFP-Farp1 (green, right). Enlarged panels show UtrCH-Cherry intensity in spine heads and along adjacent dendritic shafts, with measurement from the latter used to normalize each spine signal. Bars: (overview) 5 µm. (B) Quantification of images as in A (GFPmyr neurons, 381 spines; GFP-Farp1, 352; three independent experiments; error bars indicate mean ± SEM; ***, P < 0.001). (C and D) Farp1 increases spine actin polymerization. (C) Dendritic segments were imaged live at 14 div to detect UtrCH-Cherry. Neurons were then treated with Lat-A for 24 h to depolymerize actin, followed by recovery in Lat-A–free medium for 2 h. Panels show representative images. Bars, 5 µm. (D) Quantification of images as in C. GFP-Farp1 increases baseline UtrCH-Cherry signal in spine heads over control, and Lat-A decreases spine UtrCH-Cherry signal in both conditions. After Lat-A washout, spines expressing GFP-Farp1 exhibit a stronger increase in F-actin signal than controls (GFPmyr neurons vs. GFP-Farp1 before Lat-A, 248 and 316 spines; after Lat-A, 152 and 165; after washout, 169 and 203; three independent experiments).

