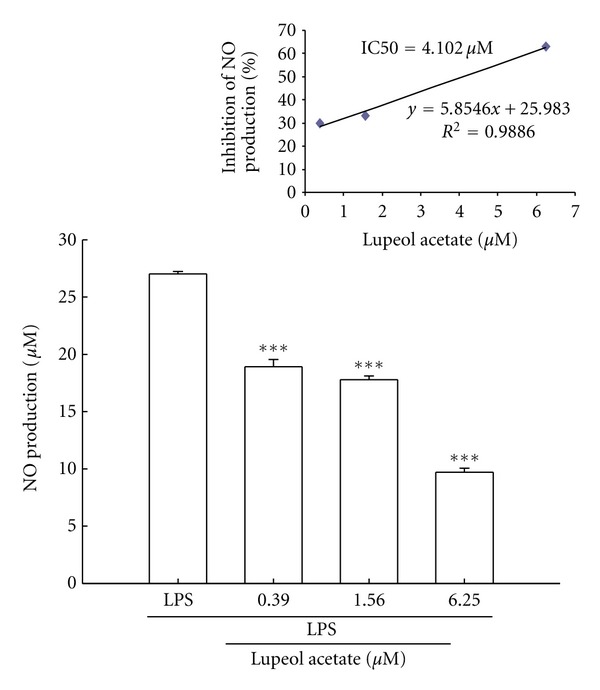
Figure 6.

Effects of lupeol acetate on LPS-induced NO production in RAW 264.7 cells. Upper panel is the IC50 of inhibition of NO production, and lower panel is the NO production. Values represent mean ± S.E. of six separate experiments. ***P < 0.001 as compared with the LPS group.
