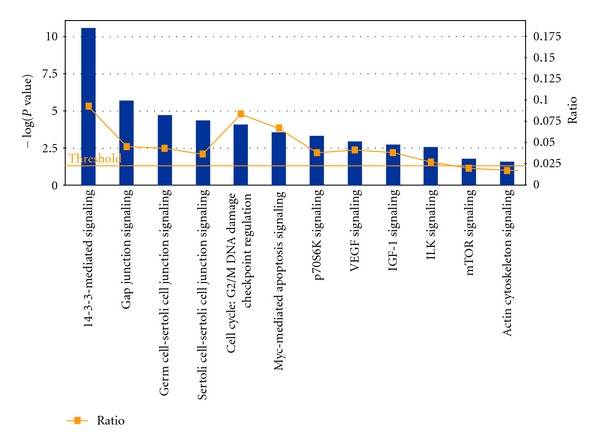
Figure 6.

The canonical pathways focus on the signaling pathways that were modulated in 15 μM 6-shogaol-treated HeLa cells as analyzed by IPA software (Ingenuity Systems, http://www.ingenuity.com/). The x-axis represents the pathways identified. The y-axis (left) shows the −log of the P value calculated based on Fisher's exact test. The ratio (y-axis, right) represented by the orange points is calculated as follows: numbers of genes in a given pathway that meet cutoff criteria, divided by total numbers of genes that make up that pathway. The orange line stands for the threshold above which there are statistically significantly (by default P < 0.05).
