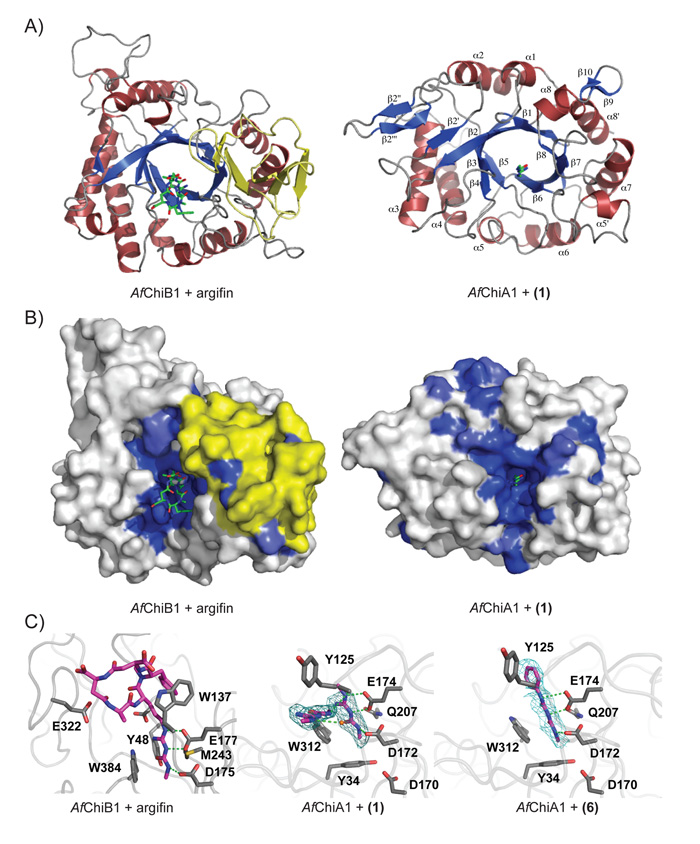
Figure 2. Structural analysis of AfChiA1 inhibitor complexes.
A) Comparison of the AfChiB1-argifin complex structure (left, PDB id 1W9V) and the complex of AfChiA1 with 1 (right). The proteins are shown in cartoon representation (α-helices in red, β-strands in blue) with the ligands drawn as sticks (green). The extra α/β domain present in the bacterial-type fungal chitinases, but lacking in the plant-type fungal chitinases, is highlighted in yellow.
B) Surface view of the structures in panel A. The AfChiB1 and AfChiA1 surfaces are shaded by sequence identity amongst A. fumigatus bacterial-type and plant-type GH18 chitinases, respectively (white=non-conserved, dark blue=completely conserved). Ligands are shown as in panel A. The extra α/β domain present in the bacterial-type fungal chitinases, but lacking in the plant-type fungal chitinases, is highlighted in yellow.
C) The active site of AfChiA1 in complex with 1/6 and AfChiB1 in complex with argifin. Side chains for important residues are shown as grey sticks and labeled. Ligands are shown as purple sticks, a water molecule is represented as an orange ball. Likely hydrogen bonds are indicated by green dashed lines. Electron density is shown contoured to 2.5 σ as a cyan mesh for AfChiA1 ligands.

