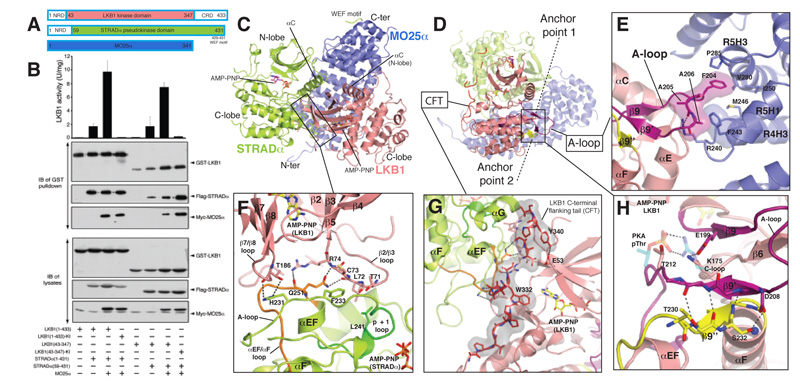
FIGURE 1. Overall structure and LKB1-STRADα-MO25α complex interactions.
A) Cartoon representation of the heterotrimeric complex and two bound AMP-PNP molecules are shown in sticks representations (LKB1, yellow carbons; STRADα, magenta carbons). The γ-P for AMP-PNP bound to LKB1 was not visible due to disorder. The WEF motif at the C-terminus of STRADα, for which connectivity could not be unambiguously identified due to disorder of the linkers, is shown in cyan.
B) Detailed view of LKB1-STRADα interaction. STRADα p+1 and αEF-αF loops are coloured green and orange respectively.
C) Interaction of the LKB1 CFTL with STRADα and LKB1 N- and C-lobes. The proline-rich CFTL is coloured red.
D) Detailed view of LKB1-MO25α interaction. LKB1 activation loop is coloured magenta.
E) Detailed view of anchor point LKB1 A-loop interactions. Backbone atoms of residues 208-210 and 230-234 are shown, whereas residues Asp208, Thr230 and Ser232 mutated in PJS are labelled and their side chains displayed. A salt bridge between Glu199 and Lys175 depicted as dashed lines, represent the interaction of LKB1 activation segment with its catalytic loop (C-loop). The corresponding interaction found in PKA (PDBID 1ATP) between the phospho-threonine 197 (pThr) and Arg165 is also shown, with PKA residues represented as transparent sticks (carbon atoms coloured cyan). The typical “activatory” threonine (Thr202) present in LKB1 A-loop is labelled. Secondary structure elements are labelled according to the structure of PKA [15].

