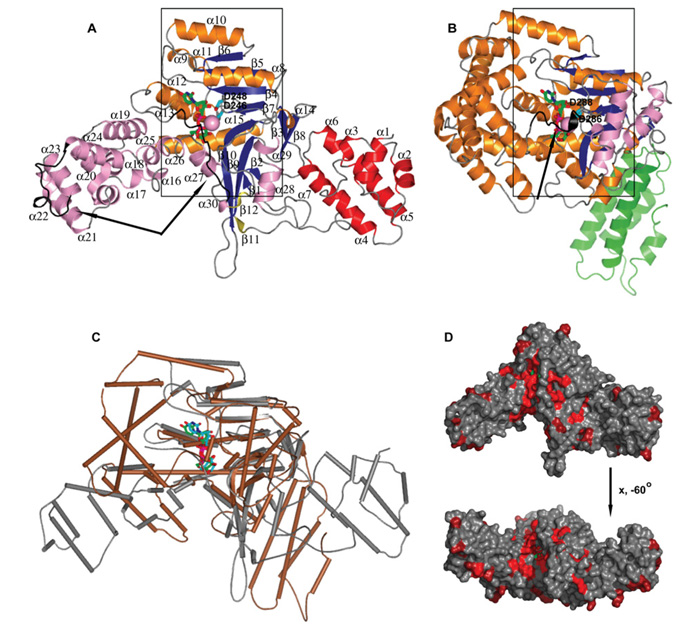
Figure 1. Structure of LpGT.
(A) Ribbon diagram of LppGT crystal structure in complex with UDP, glucose and manganese. (B) Comparison of LppGT crystal structure with TcdB (PDB codes 2BVL and 2BVM [34]). Secondary structures are represented in red and green for α-helixes of LppGT and toxin B N-terminal domain, brown and blue for α-helixes and β-strands in central domain of LppGT and toxin B, and pink and olive colour for α-helixes and β-strands of the C-terminal protrusion domain of LppGT and toxin B respectively. UDP and glucose are shown in green sticks and manganese as a pink sphere. The two aspartic acid residues (Asp246 and Asp248 in LppGT) are shown as cyan sticks. Arrows indicate flexible regions in both crystal structures. (C) Superposition of LppGT (grey) and TcdB (brown). UDP and glucose are shown in green and blue sticks in LppGT and TcdB respectively. (D) Surface representation of the LppGT enzyme, coloured by sequence conservation with Lgt2 and Lgt3 (from red, 100% identity, to grey, <50% identity).

