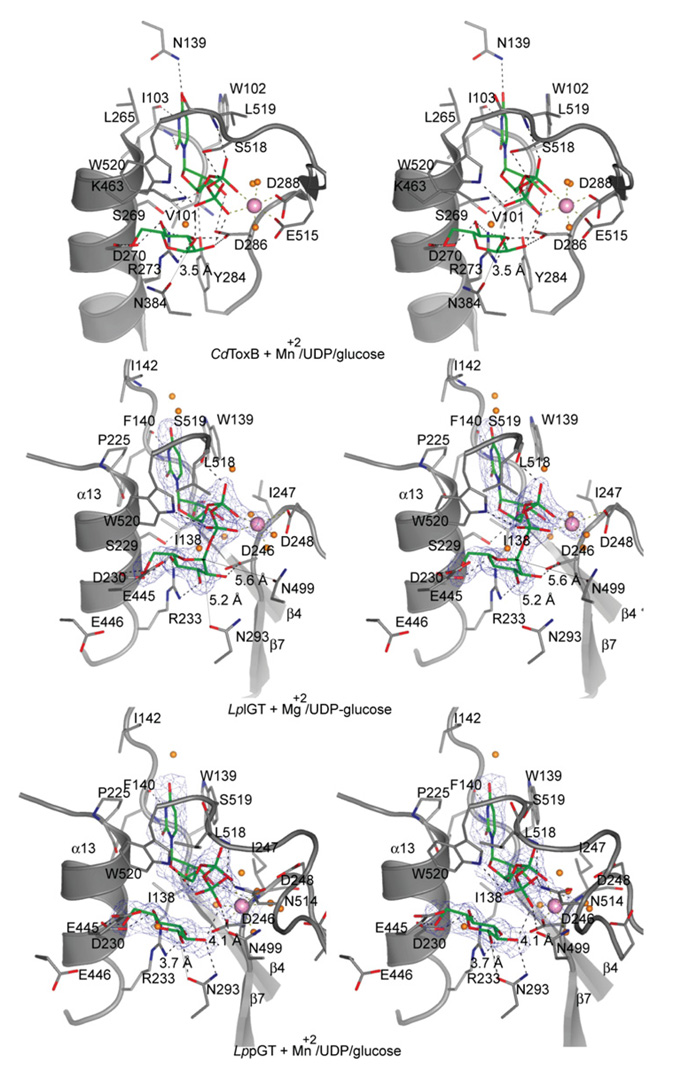
Figure 4. Active site of LpGT bound to UDP-glucose and metals.
Stereo images of the LplGT, LppGT and TcdB active sites. LplGT is shown in complex with UDP-glucose and Mg2+. LppGT and TcdB crystal structures are shown in complex with UDP, glucose and Mn2+. The amino acids are shown as grey sticks. The ligands and metals are shown as green sticks and pink spheres respectively. Protein–ligand hydrogen bonds are shown as broken black lines. The distances between Asn293 and Asn499 to the anomeric carbon are shown as thin lines. Unbiased (i.e. before inclusion of any inhibitor model) Fo–Fc, ϕcalc electron density maps are shown at 2.5 σ.

