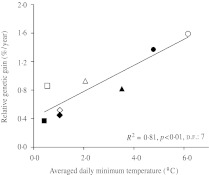
Fig. 2.
Relationship between the RGG for yield and the average daily minimum temperatures from sowing to heading. Each point corresponds to one of eight experiments identified as follows: squares, Burgos; diamonds, Albacete; triangles, Lleida and circles, Cordoba. Open and solid symbols correspond to experiments conducted in 2006 and 2007, respectively.

