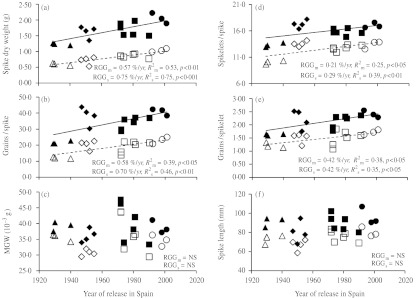
Fig. 5.
Relationships between main spike (m, closed symbols) and secondary spike (s, open symbols) components and year of release of 16 bread wheat genotypes widely grown in Spain during the 20th century. Each point represents the mean value of one genotype across four experiments. Breeding periods are identified with triangles for local landraces, diamonds for initial cultivars, squares for intermediate cultivars and circles for modern cultivars (d.f.: 15). RGG = relative genetic gain.

