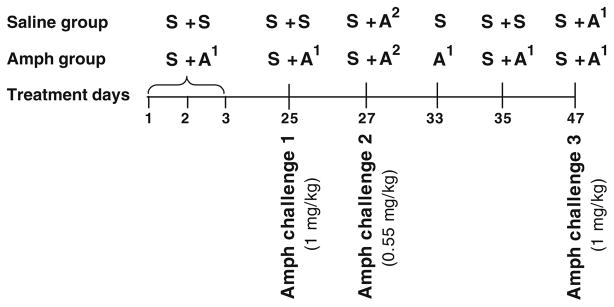
Fig. 1.
Diagram outlining treatment schedule for amphetamine experiment 1. All days represent saline (S) and amphetamine 1 mg/kg (A1) or 0.55 mg/kg (A2) treatments during the first and second hours except on day 33; mice were given their respective treatments during the first hour. In between treatment days, mice were left undisturbed in their home cages

