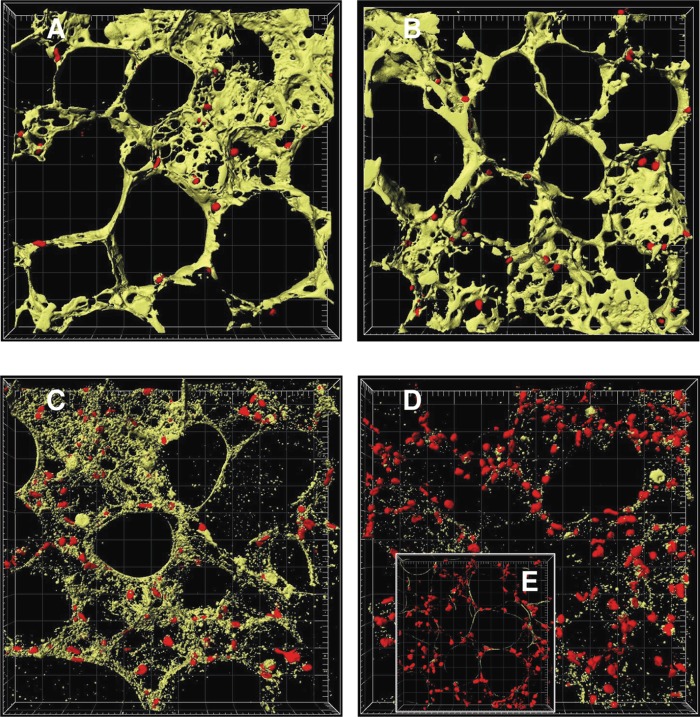
Figure 3. .
Image analysis of time-dependent cell death in murine precision-cut lung slices. Tissue slices were stained with 4 µM calcein AM and 4 µM EthD-1 after 4 h (A), 24 h (B), 48 h (C), and 72 h (D) of cultivation and after cell lysis (E). The images were examined by two-colour immunofluorescence confocal microscopy (40× water immersion objective, excitation wavelengths 488 nm and 543 nm, emission filters BP 505–550 nm and LP 560 nm, thickness 20 µm, grid spacing = 20 µm) and analysed with IMARIS 4.5.2. Red colour shows cell nuclei (Ø 5 µm) of dead cells and green colour the cytoplasm of viable cells. Picture was reproduced with permission from Henjakovic et al. 2008a.

