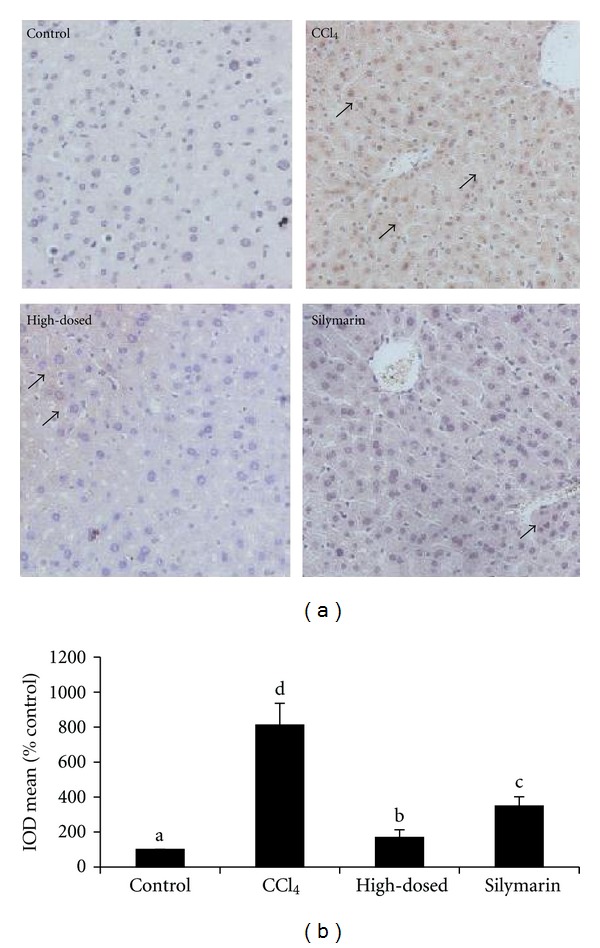
Figure 9.

(a) Immunohistochemistry for p53 in livers of the tested mice. Solid arrows point to positive areas, which are characterized by intense brown nuclear staining. Original magnification: ×100. (b) The results of immunohistochemistry analysis for p53 in livers of the tested mice. Values are given as mean ± SD (n = 3); bars with different alphabets differ significantly at P < 0.05 level.
