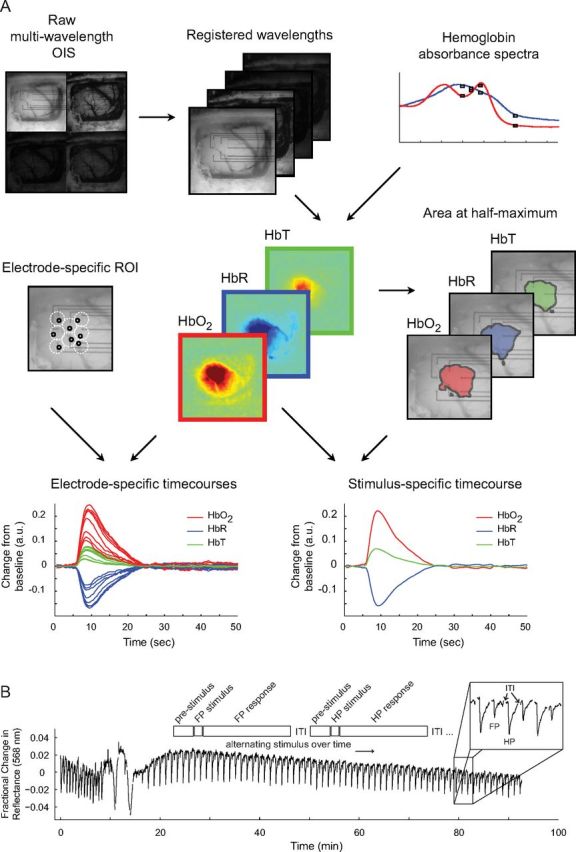
Figure 2.

Generation of hemoglobin maps and experimental paradigm. A, Raw optical images are separated into subimages based on wavelength and are spatially registered. Along with hemoglobin absorbance spectra, these images are then fit to a modified form of the Beer–Lambert law to produce maps for Δ[HbO2], Δ[HbR], and Δ[HbT]. 2dOS maps are then analyzed either as a full image or based on individual ROIs. For each hemoglobin moiety, a threshold is set to 50% of maximum amplitude change so that the area, location, and magnitude of the response to various stimuli can be characterized. Also, individual ROIs are set adjacent to each electrode, avoiding large vessels, so that a direct comparison between optical and electrical datasets can be made. OIS, Optical imaging of intrinsic signals. B, Schematic shows experimental timeline. ITI, Intertrial interval. Trace shows optical reflectance at a single ROI for every trial over the course of a typical CSD experiment (except for ITI, gaps in trace where data is not collected). Pre-CSD FP and HP responses can be seen (closely spaced downward deflections). CSD is seen as a large triphasic change in reflectance during which mapping is suppressed. A long period of post-CSD hypoperfusion is seen as an increase in reflectance, which takes ∼90 min to recover, after which deflections from evoked FP and HP mapping are visible. Note the decrease in amplitude of the FP deflection relative to HP, and both evoked deflections relative to pre-CSD. Unlike the baseline hypoperfusion, these evoked changes persist to the end of the experiment.
