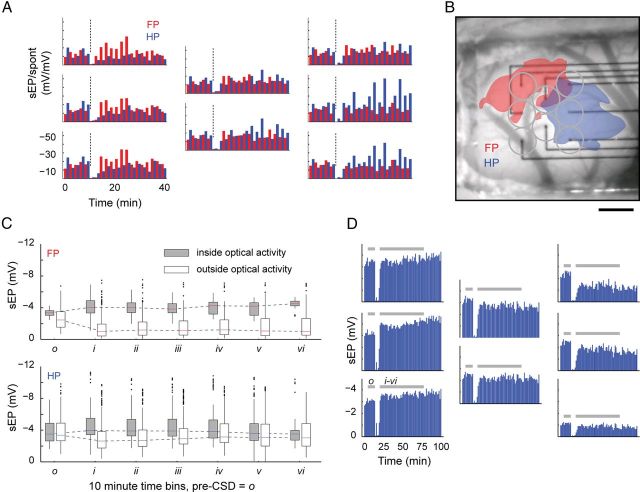
Figure 5.
Limb-dependent modulation of sensory maps after CSD. A, B, Bar plots arranged in the layout of the electrode array show the time course of alternating FP (red) and HP (blue) sEP activity for an individual animal. CSD induction is marked by a dashed line. Electrodes positioned within the optical boundaries (B) of HP activation show a marked increase in the post-CSD sEP amplitude, whereas the same electrodes show a suppression of activity during FP stimulation. A similar pattern of activity, but reversed, can be seen on electrodes situated primarily within the boundaries of FP activation. For each stimulus modality, potentiated electrodes consistently fell within the boundaries of their area of half-maximum Δ[HbT] maps. Scale bar, 1 mm. C, To confirm this, electrodes from all experiments were grouped by optical boundaries of activity, regardless of whether they were potentiated. For electrodes located inside Δ[HbT] maps, the difference between pre-CSD o and post-CSD i–v reached significance for FP and HP stimulation (both p < 0.001; exceptions: HP o/v, p = 0.955; HP o/vi, p = 0.009; FP o/vi, p = 0.019). For electrodes located outside Δ[HbT] maps, the difference between pre-CSD o and post-CSD i–vi also reached significance for FP and HP stimulation (FP, p < 0.001; HP, p < 0.01; exceptions: HP o/iv, p = 0.210). Inside FP Δ[HbT] maps, no difference was seen between any post-CSD time period, suggesting that the effects of CSD were long lasting. Inside HP Δ[HbT] maps, there was also no difference between post-CSD time bins with the exception of bin v being significantly different from bins i–vi (p < 0.001). For any CSD time period, samples (n) are taken from each electrode within the boundaries of Δ[HbT] maps, for each animal, and for all trials within that time period (inside optical activity: FP bin o–iii, n = 93; bin iv–v, n = 55; bin vi, n = 32; HP bin o, n = 191; bins i–iii, n = 197; bins iv–v, n = 166; bin vi, n = 116; outside optical activity: FP bins o–vi, n > 263; HP bins o–vi, n > 179). D, sEP traces from one of four experiments with ≥70 min of post-CSD recording, showing persistence of both potentiation and suppression to the end of the experiment, ∼80 min after CSD passage. All four long experiments showed this finding, which is in contrast to the recovery of spontaneous activity after CSD. Shading shows timing of pre-CSD bin o and post-CSD bins i–vi for comparison with pooled results in C.

