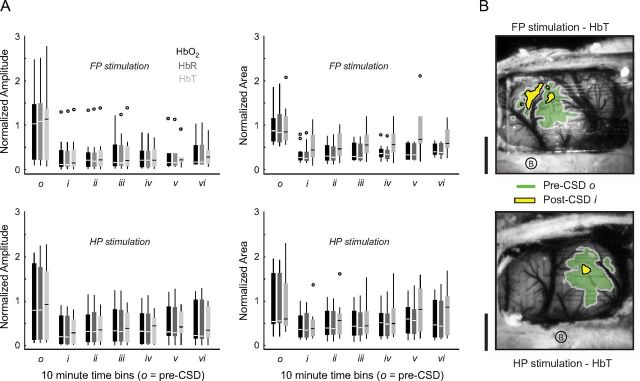
Figure 8.
Hemoglobin map sharpening after CSD. A, Hemoglobin response amplitudes (left) were significantly reduced for all moieties regardless of whether FP (top) or HP (bottom) was stimulated (both FP and HP: o/i–iii, p < 0.001; o/iv–v, p < 0.01; o/vi, p < 0.05). Area of activation (right) was significantly reduced for all moieties for both stimulus modalities (both FP and HP: o/i–vi, p < 0.001; HP, o/vi, p = 0.003). Data are normalized to pre-CSD o. B, Map contours (area at half-maximum response) are drawn for pre-CSD o and post-CSD i HbT activity, for two different animals. Post-CSD responses were uniformly concentric to the pre-CSD map, with significantly reduced area and amplitude. Scale bar, 1 mm.

