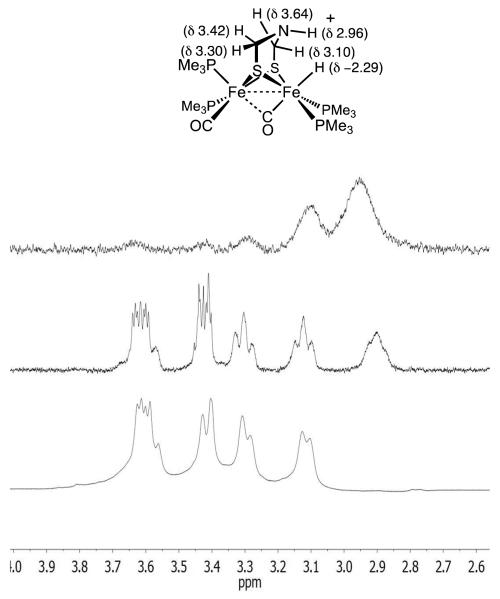
Figure 7.
1H NMR spectra in the adt region of a CD2Cl2 solution of [t-H3]+ . Top is the result of 1-D nOe experiment upon irradiation at δ −2.11. Middle and bottom: spectra before and after addition of D2O, respectively (the Fe-H signal also vanishes). The shoulder on the δ 3.6 multiplet arises from [t-H3′]+.

