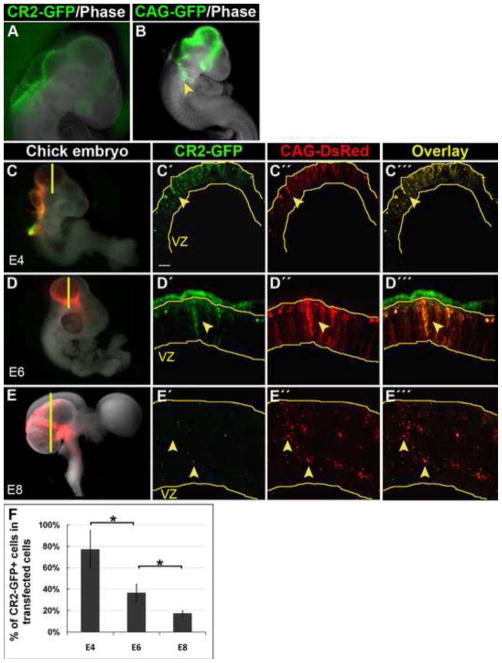
Figure 1. CR2 directs reporter GFP expression in embryonic chick CNS.
(A–B) Whole mount images of transfected chick embryos at E4 two days after electroporation at E2 (HH12). CR2-GFP expression was observed only in the CNS. CAG-GFP expression (the transfection controls) was observed in both the CNS and non-CNS tissues, e.g., the visceral arch (arrowhead). (C–E) Fluorescent microphotographs of chick brain sections showing CR2-GFP+ and CAG-DsRed+ cells in developing chick midbrain. Chick embryos were co-transfected with CAG-DsRed control and CR2-GFP at E2 and harvested at E4, E6, and E8. CR2-GFP expression decreased dramatically from E4 to E8, while control DsRed expression remained relatively constant. (F) Histograph showing that the percentage of CR2-GFP+ cells in the total number of transfection control CAG-DsRed+ cells decreased from 78% at E4, to 38% at E6, to 15% at E8. For all three developmental stages, n = 3; p<0.05. Scale bar = 10 μm.

