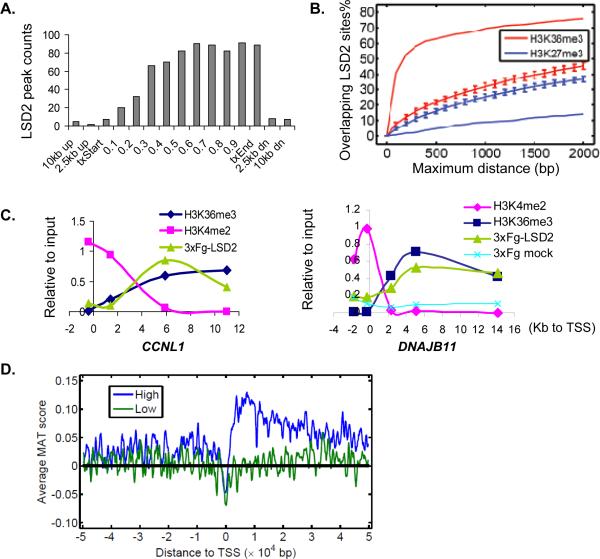
Figure 3. LSD2 binding correlates with high levels of tri-methylated H3K36 within the coding regions of actively transcribed genes.
A. Distribution of LSD2 binding sites across genes. The open reading frame of each LSD2 target gene was divided into 10 equal segments; regions corresponding to 0–2.5kb, 2.5–10kb up or down-stream each gene were also studied. The number of LSD2 binding sites within each defined segment is shown. txStart, transcription start site; txEnd, transcription end.
B. Correlation of LSD2 binding to histone modifications. Enrichment of LSD2 binding sites, presented as the fraction of total peaks, was plotted against the relative distance to known H3K36me3 (red line) and H3K27me3 (blue line) sites. Permuted distribution models are shown as hatched lines.
C. LSD2 binding at CCNL1 and DNAJB11 loci overlaps with H3K36me3 and inversely correlates with H3K4me2. Enrichment relative to input is presented in arbitrary units. Distance of qPCR primers relative to the transcription start site (TSS) is shown.
D. LSD2 preferentially associates with the gene bodies of actively transcribed genes. Genes present on the tiling array were divided into high expressing (top 50%, blue line) and low expressing (low 50%, green line) groups. Average LSD2 binding signals CHIP-chip (or MAT scores) are plotted relative to TSS within each group.

