
Figure 1.
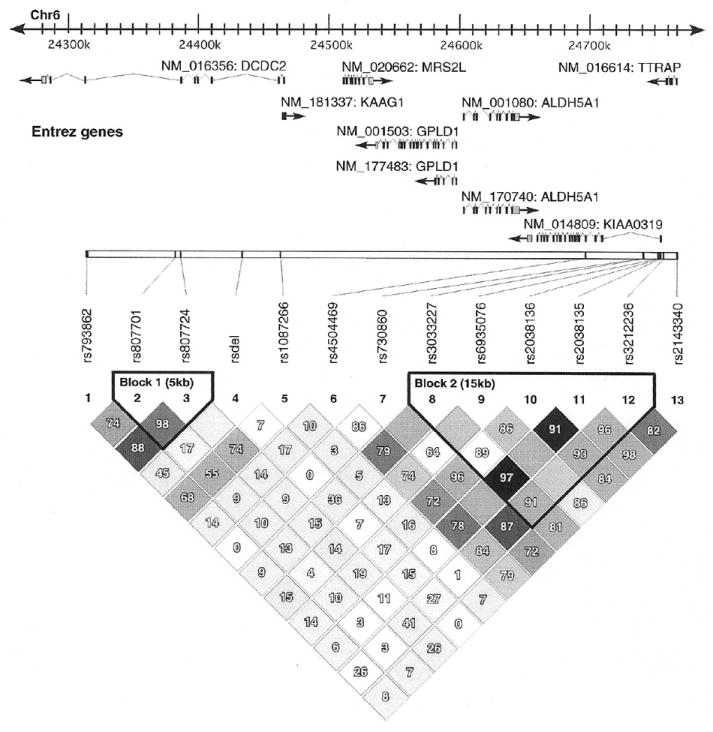
Linkage disequilibrium (LD) structure across DCDC2, KIAA0319, and TTRAP in the sample genotyped. The top portion of the figure depicts the chromosomal region spanning DCDC2 and KIAA0319 with known genes and transcripts. The bottom is a plot of LD calculated as D’ for all possible pairs of markers. rsdel refers to the BV677278 microdeletion. Darker shading indicates increased LD. Two haplotype blocks, block 1 (DCDC2) and block 2 (KIAA0319) were identified. There was no evidence for significant LD between DCDC2, KIAA0319, and TTRAP.