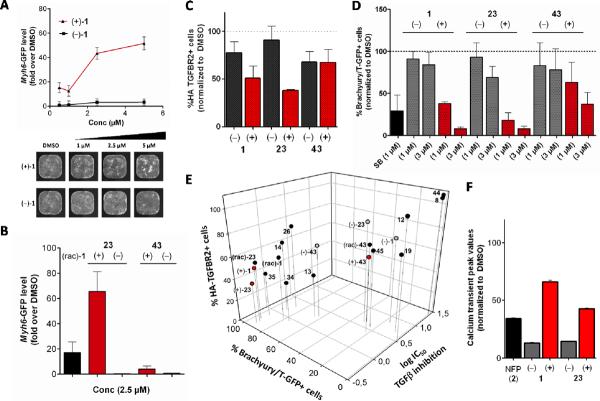
Figure 5. Characterization of 1,4-DHP enantiomers in secondary functional assays.
A) Cardiogenesis in Myh6-GFP mESC cells: lower panel illustrates representative whole-well images of mESCs on day 10 of differentiation after treatment with (+)- or (−)-enantiomers of 1 compared to media and DMSO controls, upper panel shows the corresponding plot after image analysis (mean ± SD, normalized to DMSO = 1-fold); B) Cardiogenesis in Myh6-GFP mESC cells: (+)-or (−)-enantiomers of 23 and 43 compared to (rac)-1 at 2.5 μM (mean ± SD, normalized to DMSO = 1-fold); C) TGFBR2 degradation (down regulation) in HEK-293T cells: % HA-tagged TGFBR2 positive cells after treatment with (+)-or (−)-enantiomers of 1, 23 or 43 at 3 μM doses (mean ± SD, normalized to DMSO = 100%); D) Mesoderm inhibition with J1 Brachyury/T-GFP mESC cells: % T-GFP positive cells after treatment with (+)- or (−)-enantiomers of 1, 23 or 43 at 1 and 3 μM (mean ± SD, normalized to DMSO = 100%); E) 3D correlation plot: x axis, TGFβ/Smad inhibition values (log IC50's), y-axis: mesoderm inhibition with J1 Brachyury/T-GFP mESC cells at 3 μM 1,4-DHP doses (% Brachyury/T-GFP positive cells, normalized to DMSO = 100%), z-axis: TGFBR2 degradation values at 3 μM 1,4-DHP doses (% HA-TGFBR2 positive cells, normalized to DMSO = 100%); F) Calcium transient peak values in HL-1 cells: comparison of Ca2+ transient peak values (Fluo4 levels, average pixel intensity) in the presence of (+) and (−)-enantiomers of 1 and 23 (mean ± SEM).

