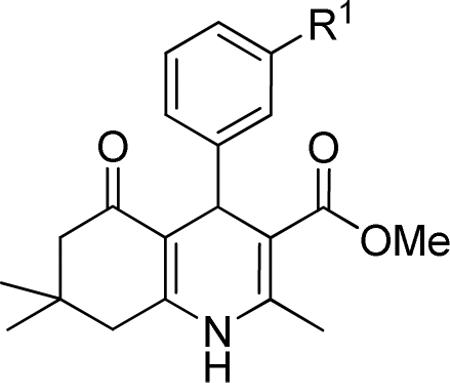
Table 1c.
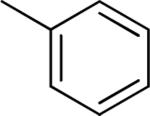
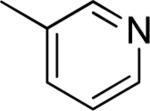
Effect of the R1 region (3'-phenyl substituents) on TGFβ inhibition.a
| compd | R1 | IC50 (μM) | %inhibition (2.5 μM) |
|---|---|---|---|
| 39 |

|
>10 | 18 ± 13 |
| 40 |

|
>10 | 5 ± 6 |
| 41 |

|
>10 | 27 ± 1 |
| 42 |

|
>10 | 10 ± 11 |
| 43 |

|
4.45 ± 2.57 | 45 ± 21 |
Data represent means ± SD of n = 2–4 independent experiments.
