
Figure 1.
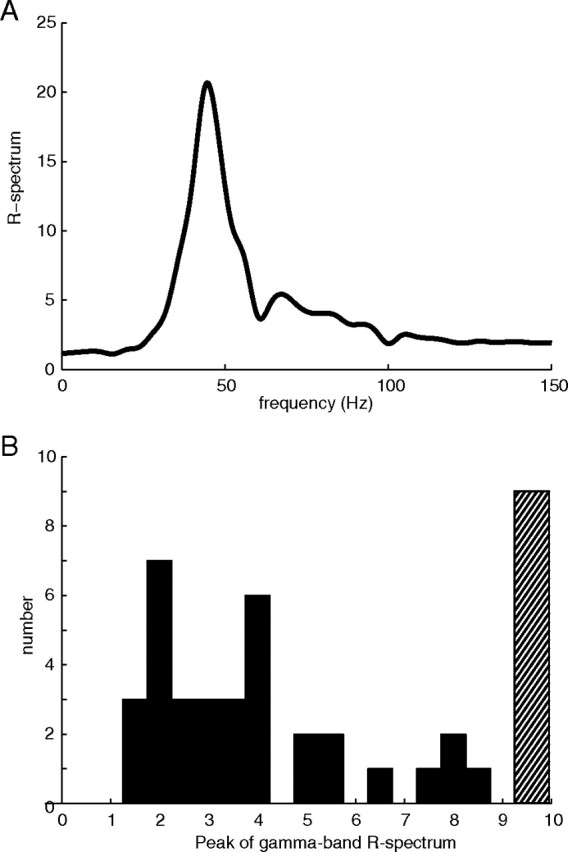
A, Population average R-spectrum (stimulated power spectrum divided by spontaneous power spectrum; see Materials and Methods); the power spectrum of the response to visual stimulation is dominated by a peak in the gamma band centered around 40 Hz. B, Histogram of population maximum gamma-band (20–90 Hz) R-spectrum (>9 placed in hatched bin above 9). All sites had maximum R-spectrum values in the gamma band greater than 1, indicating a response to the stimulus.