
Figure 10.
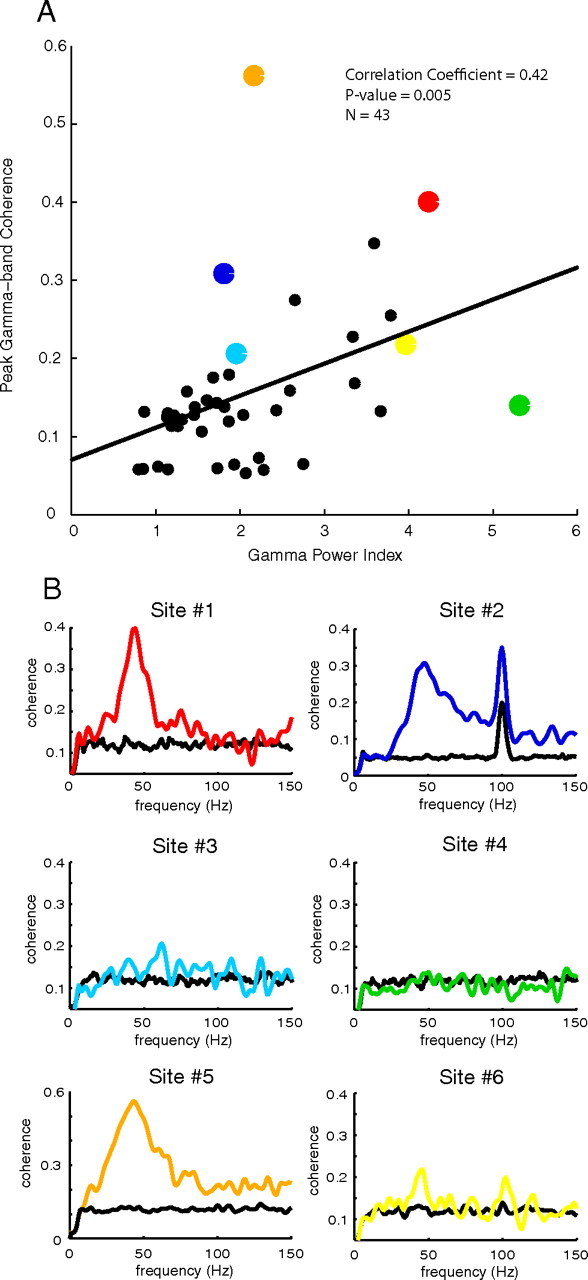
A, A scatter plot of the GPI and the maximum gamma-band coherence; the coherence in the gamma band increases as the gamma-band power increases. B, Example sites color coded with their corresponding points in the scatter plot (95th percentile of the shift predictor for each site is plotted in black).