
Figure 5.
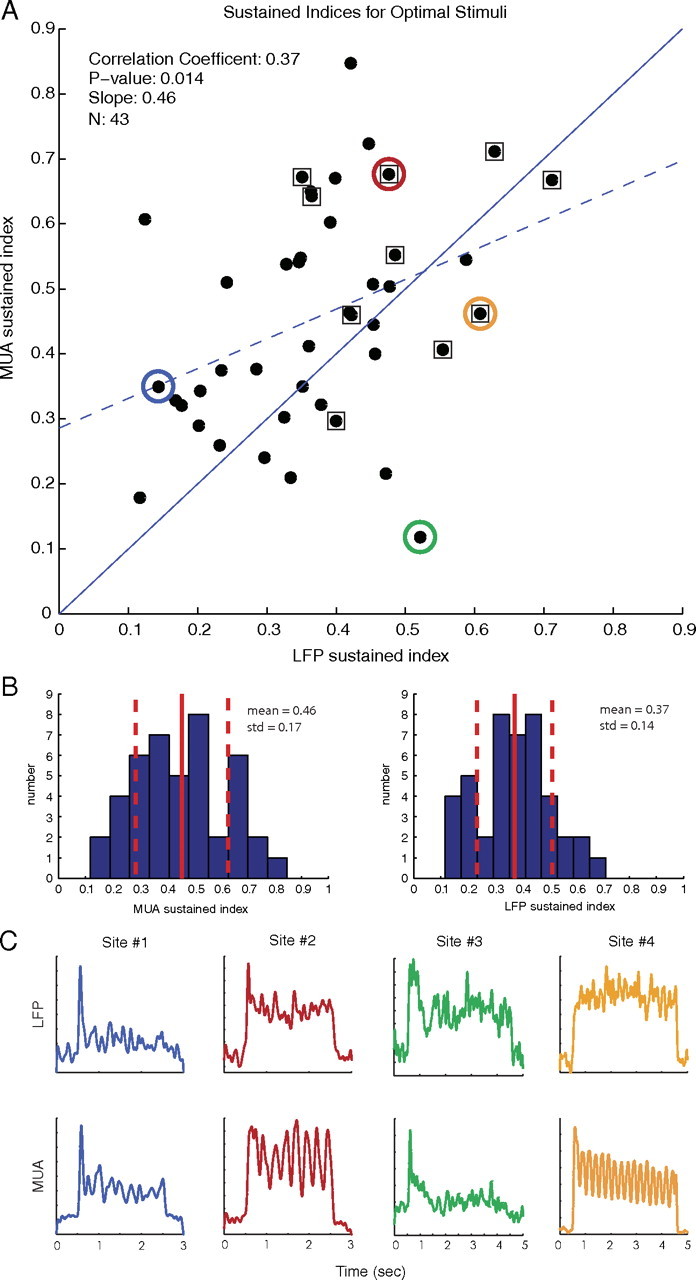
A, Scatter plot of sustained indices in response to optimally oriented stimuli with linear regression (dashed blue line) and reference unity line (solid blue line). Sites with MUAs that track the phase of the visual stimulus are surrounded by a square. There was a large amount of variability in the response of the LFP and MUA, but a majority of points lie above the unity line, indicating that more sites had MUAs that were more sustained than LFPs. B, Histograms of the population MUA and LFP sustained indices for optimal stimuli with mean and SD. On average, the MUA was more sustained then the LFP for stimuli at the optimal orientation. C, LFP and MUA responses of four example cells to optimal stimuli; the indices of these responses are color coded in the scatter plot. A wide variety of responses are seen for both the MUA and LFP at individual sites.