
Figure 7.
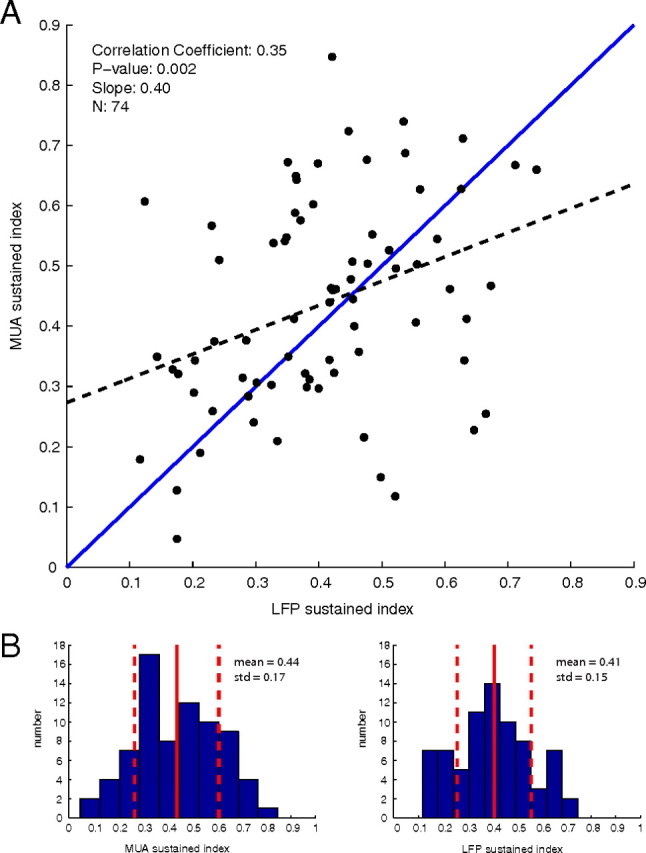
A, Scatter plot of sustained indices in response to all oriented stimuli with linear regression (dashed blue line) and reference unity line (solid blue line). B, Histograms of the population MUA and LFP sustained indices for all oriented stimuli with mean and SD. When all orientations are included, the mean MUA and LFP response are nearly equal.