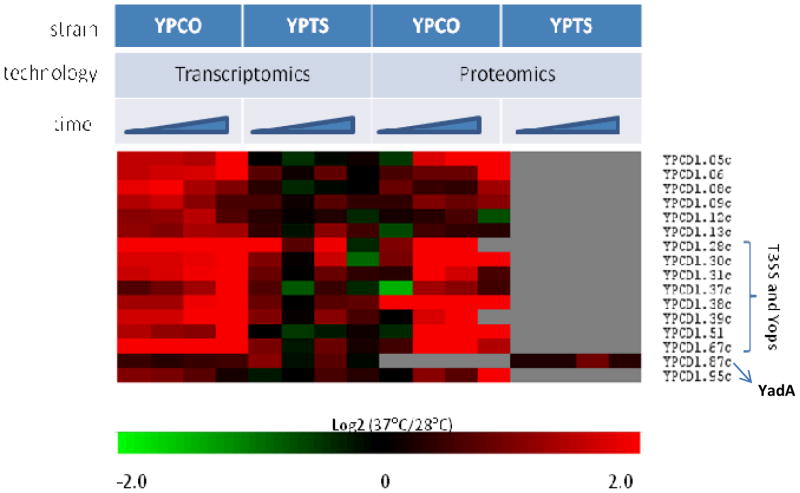
Figure 1.
Heat map illustration of pCD1-encoded proteins, detected by both proteomics and transcriptomics, preferentially up-regulated in YPCO relative to YPTS in response to temperature elevation. Time represents sampling points at 1hr, 2hr, 4hr, 8hr. YPCO, Yersinia pestis CO92; YPTS, Yersinia pseudotuberculosis PB1/+.

