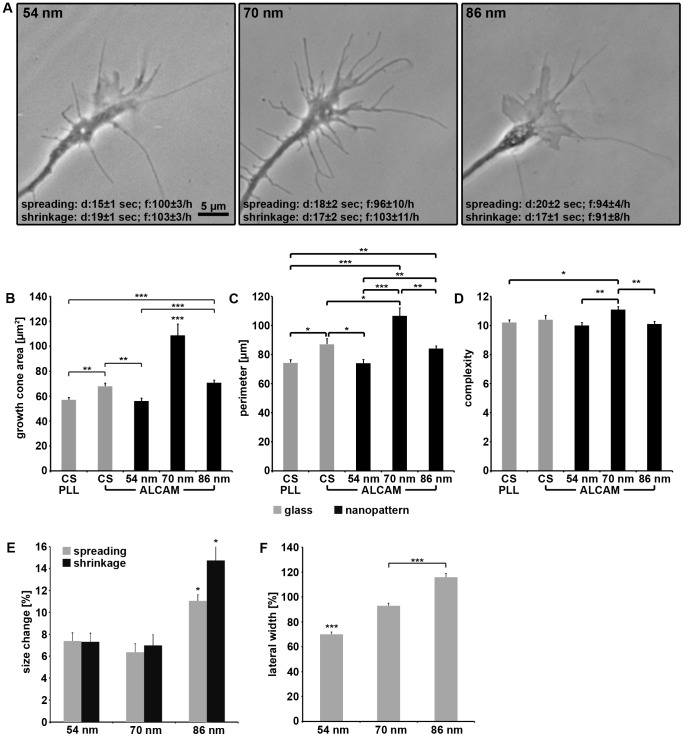
Figure 6. Growth cone dynamics on various substrates.
(A) Phase contrast micrographs of growth cones on various ALCAM nanopatterns. Note that duration (d) and frequency (f) of growth cone size changes (spreading, shrinkage) do not differ significantly (between p<0.07 and p<0.6) on the various nanopatterns (ten growth cones each). (B) Quantification of growth cone area, (C) perimeter, and (D) complexity (perimeter/ ) on PLL-/ALCAM-coated glass or on various ALCAM nanopatterns (155 growth cones quantified for each substrate). (E) Quantification of change in growth cone size (spreading/shrinkage) expressed as percentage of growth cone area on various ALCAM nanopatterns (ten growth cones each; monitored for 300 sec, every 10 sec). (F) Quantification of growth cone width (expressed as percentage of growth cone length) on various ALCAM nanopatterns. Error bars represent SEM; for statistical analyses, two-way ANOVA followed by post-hoc comparisons using two-tailed Student's t test with Bonferroni-Holm corrections were performed (***P<0.001, **P<0.01, *P<0.05).

