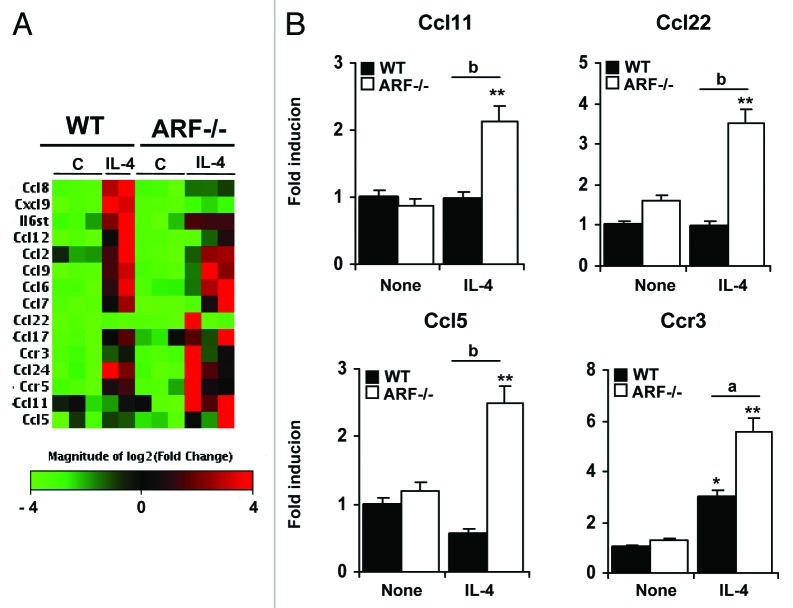
Figure 6. Gene expression profile of ARF-deficient macrophages after IL-4 stimulation. (A) Microarray analysis was conducted on 3 independent preparations of unstimulated macrophages or macrophages treated with 20 ng/mL IL-4 for 6 h. Hierarchical clustering of genes induced by IL-4 (fold induction > 2 and p < 0.05 on a 2-tailed paired Student’s t test comparing M2 vs unstimulated macrophages) is shown, together with genes differentially expressed in Arf−/− macrophages as compared with WT cells. Columns report gene names and fold increase upon IL-4 treatment vs. untreated conditions, for both WT and Arf−/− macrophages. (B) A panel of genes was selected for validation by quantitative PCR analysis based on the microarray results. Results were obtained from three independent experiments performed in triplicate and data are reported as means ± SD *p < 0.05, and **p < 0.01 as compared with none condition, and ap < 0.05, bp < 0.01, as compared with WT cells.

An official website of the United States government
Here's how you know
Official websites use .gov
A
.gov website belongs to an official
government organization in the United States.
Secure .gov websites use HTTPS
A lock (
) or https:// means you've safely
connected to the .gov website. Share sensitive
information only on official, secure websites.
