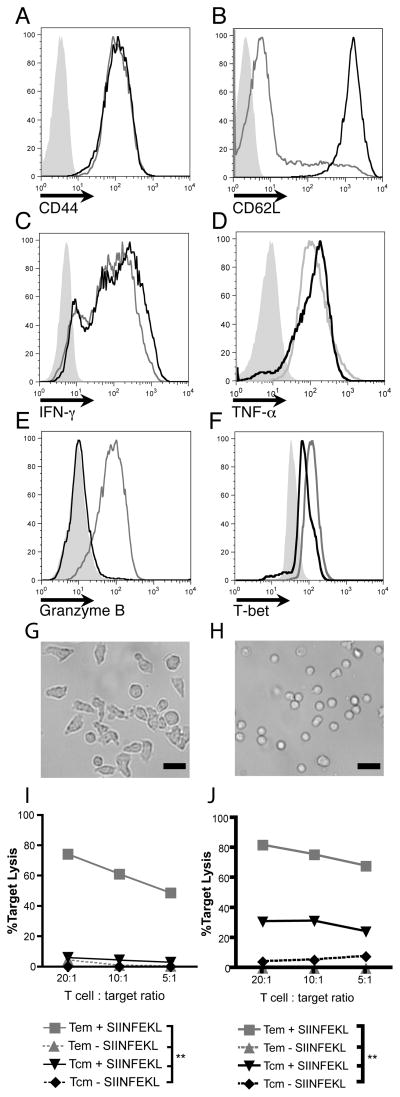
Figure 2. Ex vivo differentiated TCM and TEM exhibit extracellular markers, intracellular molecules and killing capacity characteristic of TCM and TEM.
A&B. CD44 and CD62L staining of OT-I in vitro derived TCM (black lines) and TEM (grey lines) cultured as per materials and methods. Isotype control shown in filled grey histograms. C–E. Intracellular Interferon-γ, tumour necrosis factor-α, granzyme B expression in in vitro differentiated TCM and TEM following stimulation with PMA/ionomycin. TCM shown as black lines, TEM as grey lines and unstimulated cells shown as filled grey histograms. F. Intracellular expression of the T-box transcription factor T-bet. TCM shown as black lines, TEM as grey lines and naïve cells shown as filled grey histograms. All vertical axes in histograms are frequency of cells as percentage of total cells analysed. Flow cytometry plots represent one three individual experiments conducted with pooled lymphocytes from OT-I mice. G&H. Micrograph of OT-I TEM (G) and TCM (H). Photos represent one of two individual experiments using pooled lymphocytes. Scale bar = 20μm. I & J. In vitro cytotoxic killing assays of TCM (black lines) and TEM (grey lines) demonstrating chromium release following 2.5 hours (K) and 5 hours (L) of exposure to SIINFEKL-pulsed (sold lines) and non-pulsed targets (broken lines). **p<0.01 by one-way ANOVA test with Bonferroni post-hoc analysis. Target lysis calculated by [(sample − spontaneous)/(maximum − spontaneous)] × 100%.

