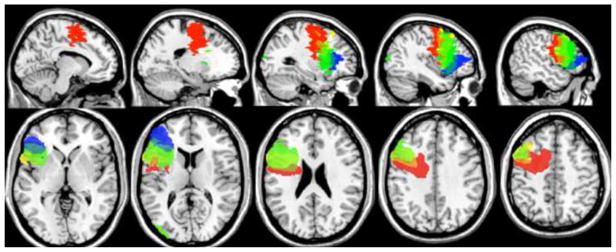
Figure 1.
Red = P2; Yellow = P3; Green = P4; Blue = P5; Orange = overlap between P2 and P3; Yellow+Green = overlap between P3 and P4; Blue+Green = overlap between P4 and P5. Top: from left to right, medial to lateral sagittal slices at MNI X coordinates = −10, −20, −30, −40 and −50. Bottom: from left to right, ventral to dorsal axial slices at MNI Z coordinates = 0, 12, 24, 36 and 48.

