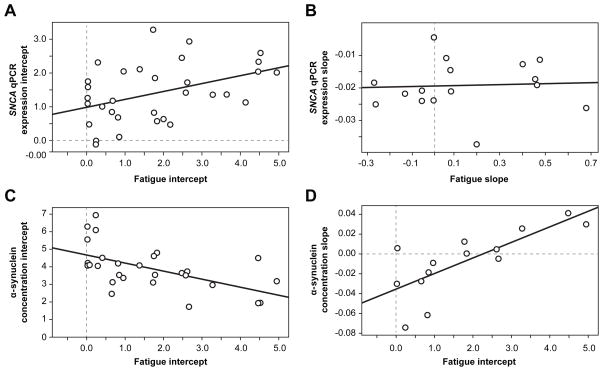
Figure 5. Correlation between fatigue and α-synuclein expression.
The changes of fatigue and gene/protein expressions were modeled in a linear fashion. The intercept of the individual growth curve represents the estimated baseline (D0) value for each patient based on a linear trajectory of the values over time during EBRT. The slope of the individual growth curve represents the estimated rate of change over time for each patient based on a linear trajectory of their scores. The intercepts and slopes of fatigue scores were estimated based on mixed model for each patient and the resulting estimated intercepts and slopes were then correlated.
Figure 5a. Correlation between fatigue and SNCA qPCR expression intercepts.
SNCA = alpha-synuclein gene; qPCR = quantitative polymerase chain reaction
Figure 5b. Correlation between fatigue and SNCA qPCR expression slopes.
SNCA = alpha-synuclein gene; qPCR = quantitative polymerase chain reaction
Figure 5c. Correlation between fatigue and α-synuclein protein intercepts.
Figure 5d. Correlation between fatigue intercept and α-synuclein protein slope.

