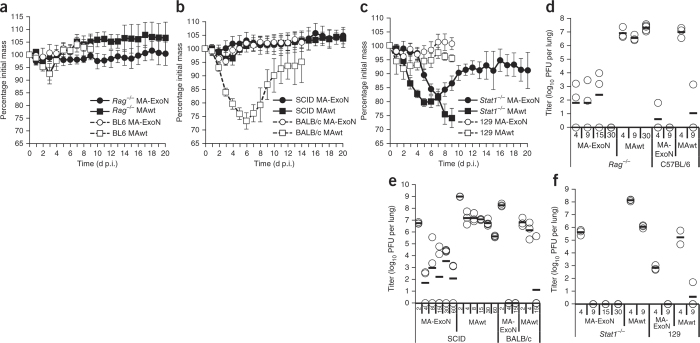
Figure 3. Weight loss and lung titer in young immunocompromised mice.
(a–c) MA-ExoN and MAwt infections of 10-week-old Rag−/− (a), SCID (b) and Stat1−/− (c) mice. C57BL/6 (a), BALB/c (b) and 129 (c) mice were included as background controls. Weight loss is shown. Dark shapes and solid lines, immunocompromised mice; white shapes and dashed lines, background control mice; circles, MA-ExoN; squares, MAwt. Error bars indicate s.d. (d–f) Lung titers for Rag−/− (d), SCID (e) and Stat1−/− (f) mice and background controls. The titer of each mouse lung is indicated by an open circle; the mean of all titers at each time point is indicated by a horizontal bar. Days p.i. are indicated on the x axes.

