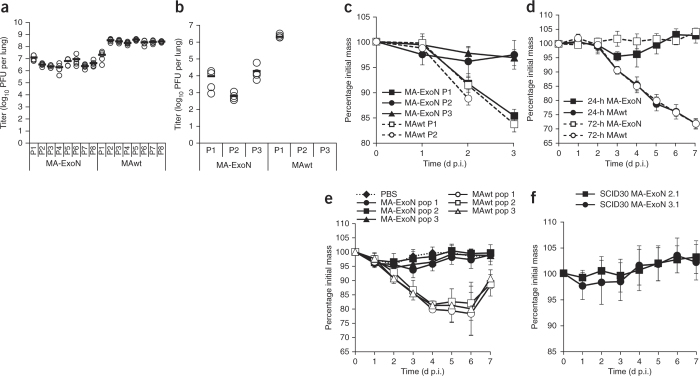
Figure 5. Virulence of passaged MA-ExoN and MAwt viruses.
(a–c) MA-ExoN and MAwt serial infections of 12-month-old female BALB/c mice. Passages (P) are indicated on the x axes. (a) Serial passage after 24 h. (b,c) Serial passage after 72 h. (a,b) Lung titers are shown, with average titers indicated by bars. In the 72-h passage, MAwt-infected mice died by day 3 of passage 2; thus, the viruses were not passaged further. (c) Weight loss in the mice infected in the 72-h passage is shown. Error bars indicate s.d. (d) MA-ExoN (24-h passage 8 and 72-h passage 3) and MAwt (passage 1) infections of 12-month-old female BALB/c mice. Weight loss is shown. Error bars indicate s.d. (e) Infections of 10-week-old female BALB/c mice with MA-ExoN and MAwt population viruses isolated from SCID mice at 30 d p.i.; weight loss is shown. Dashed line, mock (PBS) inoculation; dark shapes and solid lines, MA-ExoN; white shapes and solid lines, MAwt. For each virus, lungs from three separate mice were harvested (mouse 1–mouse 3), and viruses were subsequently inoculated without plaque purification (population); circles, mouse 1 populations (pop 1); squares, mouse 2 populations (pop 2); triangles, mouse 3 populations (pop 3). (f) Weight loss in 11-month-old female BALB/c mice infected with MA-ExoN 2.1 (with C16999A) or MA-ExoN 3.1 (without C16999A) plaque isolates from SCID mice after 30 d of infection (SCID30). Squares, SCID30 MA-ExoN 2.1; circles, SCID30 MA-ExoN 3.1. Error bars indicate s.d.

