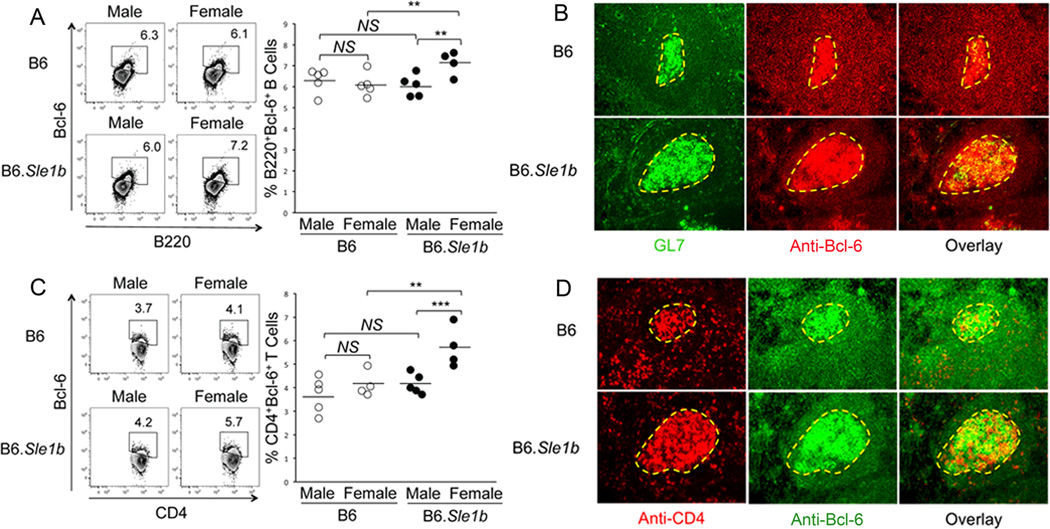
Figure 5. Increased number of Bcl-6 expressing B and CD4 T cells in B6.Sle1b female mice.
Splenocytes obtained from sex matched, 6–9 month old B6 and B6.Sle1b mice were stained for Abs against either B220 and Bcl-6 (A) or CD4 and Bcl-6 (C) and analyzed by flow cytometry. The left flow cytometry plots are representative images from each group while the scatter plots on the right indicate the range of B220+Bcl-6+ B cell (A) and CD4+Bcl-6+ T cell (C) percentages from each group. Each circle represents an individual mouse and horizontal bars represent the mean values. Statistical analysis was performed as described in Materials and Methods. Spleen sections obtained from 6–9 month old female B6 and B6.Sle1b mice were either stained with GL7 (green) and anti-Bcl-6 (red) (B) or anti-CD4 (red) and anti-Bcl-6 (green) (D). The data shown in B and D were obtained from 4 to 5 female mice of each genotype. Original magnification of the images was 200×.

