
Figure 7. Increased ANA-specific AFCs in B6.Sle1b female mice.
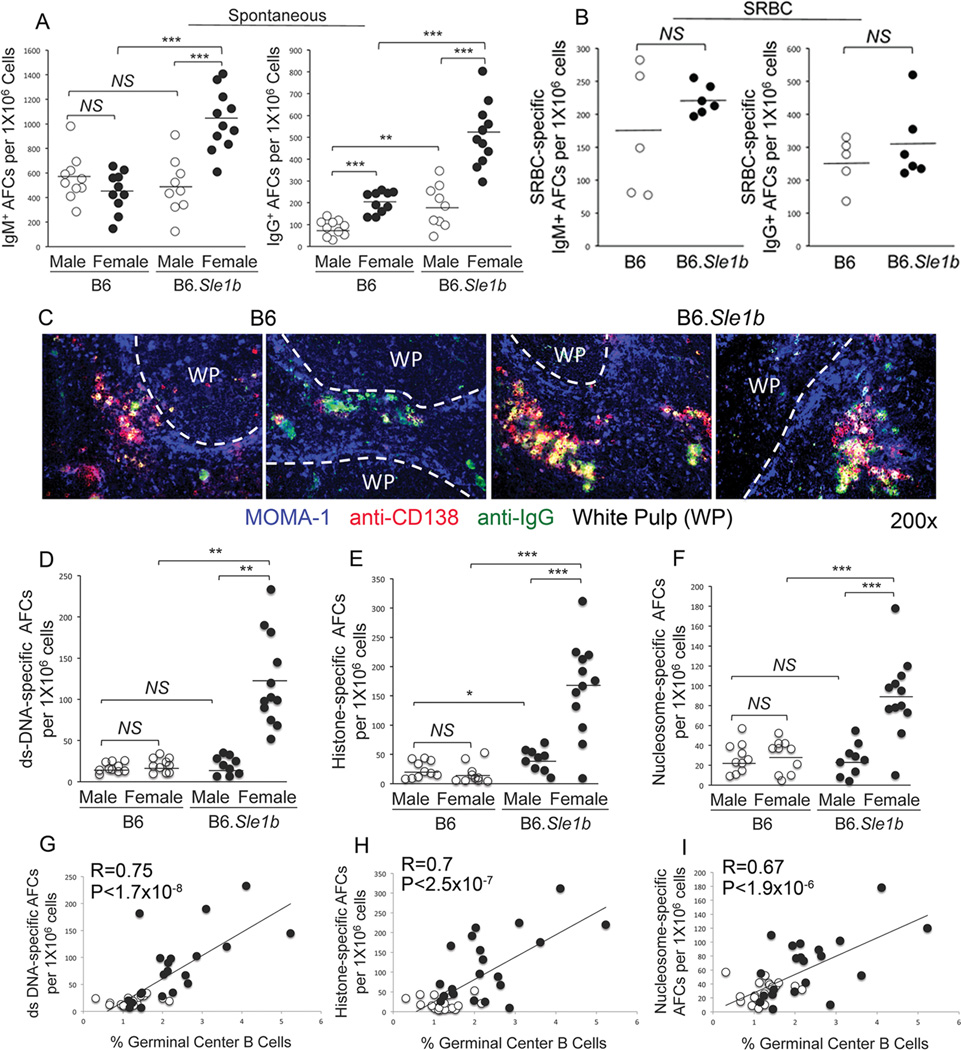
Total number of IgM (left panel) and IgG (right panel) specific AFCs in un-immunized 6–9 month old (A) and SRBC-immunized 5–6 week old (B), sex-matched B6 and B6.Sle1b mice were measured by ELISpot assay. (C) Spleen sections obtained from 6–9 month old female B6 and B6.Sle1b mice were stained for MOMA-1 (blue), anti-CD138 (red), and anti-IgG (green). WP represents white pulp. Original magnification of the images was 200x. Representative data from 5 female mice of each genotype are shown. The number of ds-DNA- (D), histone- (E), and nucleosome- (F) specific AFCs were measured by ELISpot assay. The degree of correlation between GC B cells and ds-DNA- (G), histone- (H), and nucleosome- (I) specific AFCs was analyzed. Each circle represents an individual mouse and B6.Sle1b mice are depicted in black circles while B6 mice are depicted in white circles. Statistical analysis was performed as described in Materials and Methods.