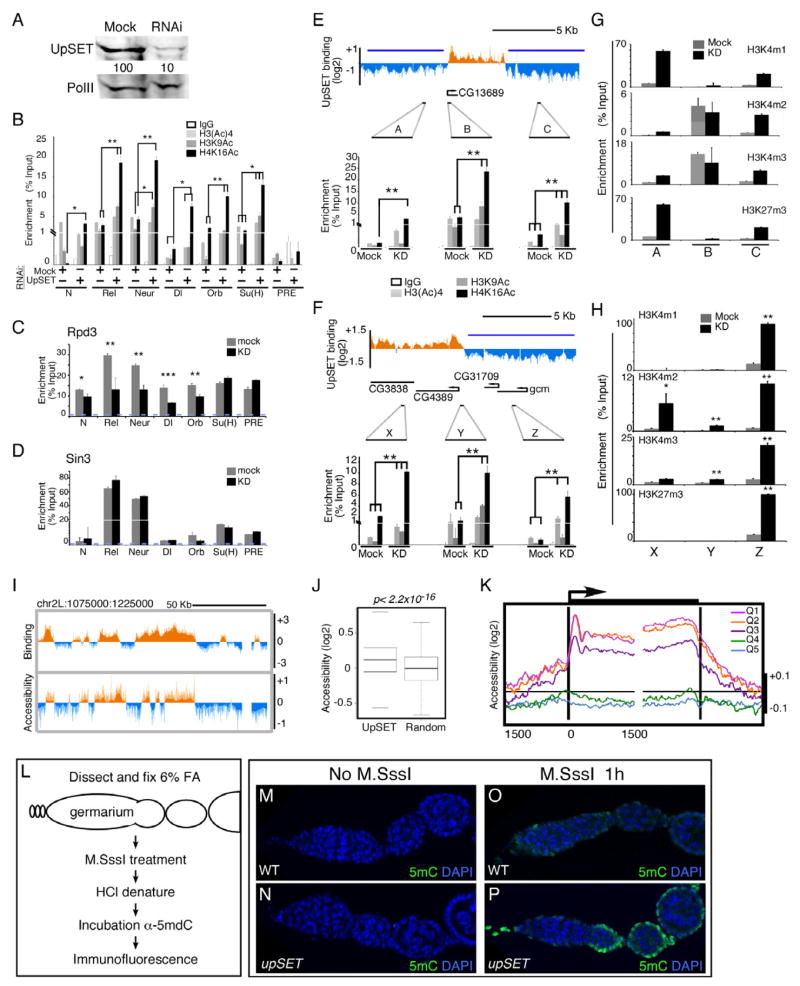
Figure 4. UpSET modulates active chromatin modifications of transcriptionally active genes.
(A) RNAi-based knock down of UpSET levels. Western blot for UpSET from nuclear extracts of Mock and UpSET-specific RNAi expressing cells same antibodies as in Figure 1J. RNA Pol II was used as loading control.
(B) UpSET knock down increases histone acetylation over UpSET bound promoters (TSS). Native ChIP of H3Ac, H3K9Ac and H4K16Ac from Mock and UpSET knock down cells as indicated. Data are represented as mean +/− standard error of the mean (SEM). N: Notch; Rel; Relish; Neur: neuralized; Dl: Delta; Orb: oo18 RNA-binding protein; Su(H): Suppressor of Hairless, and the PcG-silenced C15 gene, as negative control. (*: p<0.05; **: p<0.01; ***: p<0.001, non-significant p values are not marked).
(C–D) Cross-linked ChIP for Rpd3 and Sin3 from Mock and UpSET knock down cells. Bars represent mean +/− SEM.
(E–F) Histone acetylation increases around UpSET-depleted genes. Native ChIP of H3Ac, H3K9Ac and H4K16Ac from Mock and UpSET knock down cells as indicated. UpSET chromatin profiles show the location of the used primers. Repressive chromatin reported from (Bartkuhn et al., 2009); blue line). Bars represent mean +/− SEM.
(G–H) Native ChIP of H3K4m1, H3K4m2, H3K4m3 and H3K27m3 from Mock and UpSET knock down cells. Primers are same as in Figure 4E–F. Bars represent mean +/− SEM. (*: p<0.05; **: p<0.01; ***; p<0.001).
(I) UpSET depletion increases the accessibility of UpSET bound regions. Chromatin accessibility ratio in KD:mock treated cells from a 150Kb region of chromosome 2L.
(J) UpSET associated regions show increased accessibility. Chromatin accessibility signal distributions over UpSET bound regions or random sites. p<2.2x10⁻¹⁶
(K) UpSET modulates chromatin accessibility of transcriptionally active genes. End analysis of the chromatin accessibility signal in UpSET knock down cells over the 5’ and 3’ ends of genes clustered by expression quintiles from high (Q1) to low (Q5) gene expression as indicated.
(L–P) Chromatin accessibility in situ. Schematic of M.SssI DNA methyltransferase accessibility assay in ovaries. Low CpG methylation as detected by 5mC immunofluorescence in untreated Drosophila germarium from wildtype (M) and upSETe00365 mutants (N). Higher chromatin accessibility in M.SssI-treated upSETe00365 mutant ovaries (P) compared to wildtype (O). See also Figures S3-S5.

