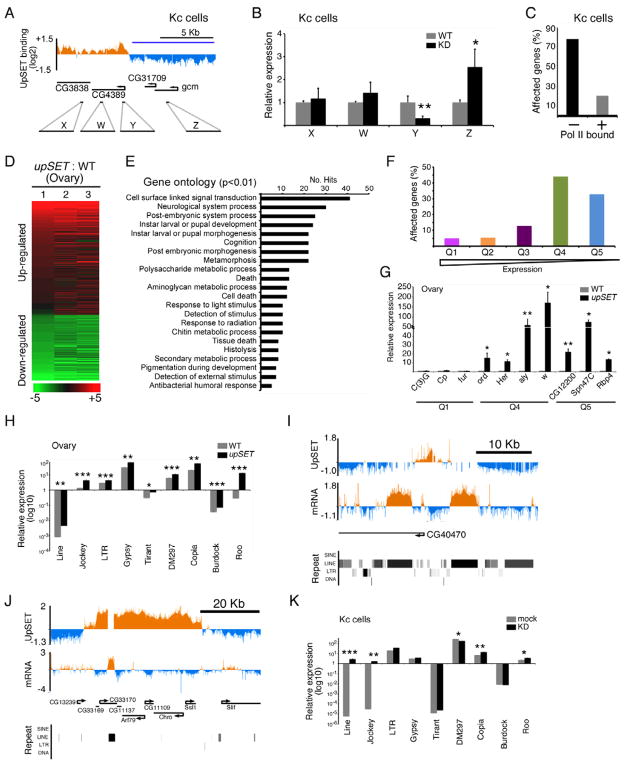
Figure 5. UpSET modulates off-target gene.
(A–B) UpSET knock down up-regulates silent genes. Gene expression analysis of knock down Kc cells using primers (W–Z) targeting the genomic region from Figure 4F, as well as the coding sequence of the UpSET target gene CG4389. (*: p <0.05; **: p<0.01; Not significant p values are not marked).
(C) Non-expressed genes are more affected upon UpSET knock down. Genes differentially expressed in UpSET knock down cells were clustered by their association with RNA polymerase II.
(D–E) Transcriptome analysis of upSETe00365 mutant ovaries. Heat maps show the summary of three biological replicates of independent upSETe00365 mutant ovaries compared to wildtype (D). Up-regulated (red) and down-regulated (green) genes are shown. Gene ontology analysis of the differentially expressed genes (E). 22 categories were enriched in the dataset (p <0.001).
(F) RNA-seq from wildtype ovaries (modENCODE) was clustered in gene expression quintiles from high (Q1) to low (Q5) and upSETe00365-affected gene percentage for each quintile is shown.
(G) Low/silent genes are up-regulated in upSETe00365 mutants. RT-qPCR of low expressing genes (Q4-5) was compared to highly expressed genes (Q1). (*: p <0.05; **: p<0.01; Not significant p values are not marked).
(H–K) Loss of UpSET increases expression of transposons. RT-qPCR of transposons from 9 representative repetitive element families found near UpSET binding sites in upSETe00365 mutant ovaries (H) or UpSET knock down Kc cells (K). cDNA tiling analysis of transposon expression in upSET e00365 ovaries with DamID chromatin profile for a single peak (I) or region (J) of UpSET binding (see also Figure S2A). The middle track shows mRNA expression in ovaries. Repeat element locations are shown in lower panel. Bars represent mean +/− SEM. (*: p <0.05; **: p<0.01; Not significant p values are not marked)
See also Figure S6.

