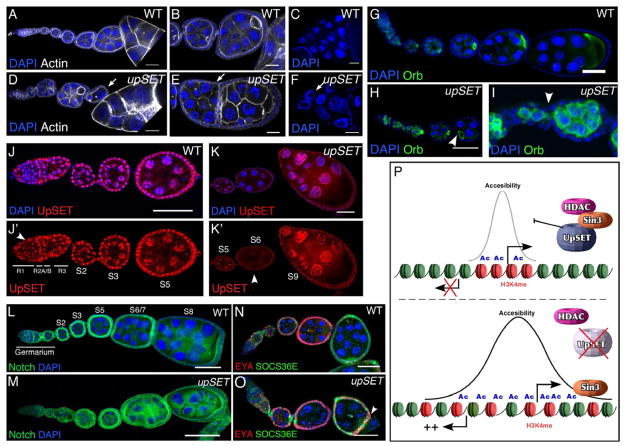
Figure 6. UpSET modulates developmentally regulated gene silencing.
(A–F) upSET mutants show incomplete or fused egg chambers (arrows) in comparison to wildtype. Wildtype (A–C) and upSETe00365 mutant (D–F) ovarioles stained with DAPI (blue; to visualize DNA) and phalloidin (white). Confocal projections of 5 serial 1μm optical sections are shown.
(G–I) UpSET is required for the establishment of anterior-posterior axis asymmetry and proper egg chamber formation. Wildtype (G) or upSETe00365 mutant (H–I) ovarioles stained with the oocyte-specific marker Orb showing alterations on the oocyte position and improper pinching off of egg chambers (arrowhead) from the germarium. Confocal projections of 8 serial 1μm optical sections are shown.
(J–K’) UpSET protein levels are differentially regulated during oogenesis. Wildtype ovarioles were stained with a mix of antibodies against UpSET NH3- and COOH- termini and co-stained with DAPI (blue). Confocal projections of 5 serial 1μm optical sections are shown. Arrowhead indicates regions with differential UpSET levels.
(L–M) Wildtype (L) and upSETe00365 mutant (M) ovaries stained with antibodies against the Notch intracellular domain (green) and DAPI (blue).
(N–O) Co-staining of SOCS36 (green) and Eya (red) in wildtype (N) and upSETe00365 mutant (O) ovarioles. DAPI (blue) was used to visualize DNA. Overlapping expression is indicated with an arrowhead in upSET mutant ovary.
(P) UpSET restricts histone acetylation and chromatin accessibility around promoter/genic regions via interaction and stabilization of Rpd3/Sin3-containing HDAC machinery. Lack of UpSET increases chromatin accessibility that correlates with a higher histone acetylation level due to the loss of Rpd3 from transcriptionally active genes. Changes in the chromatin landscape increase the probability of activating transposon expression and off-target genes.
Posterior is oriented to the right in all images. Scale bars represent 50μm.
See also Figure S7.

