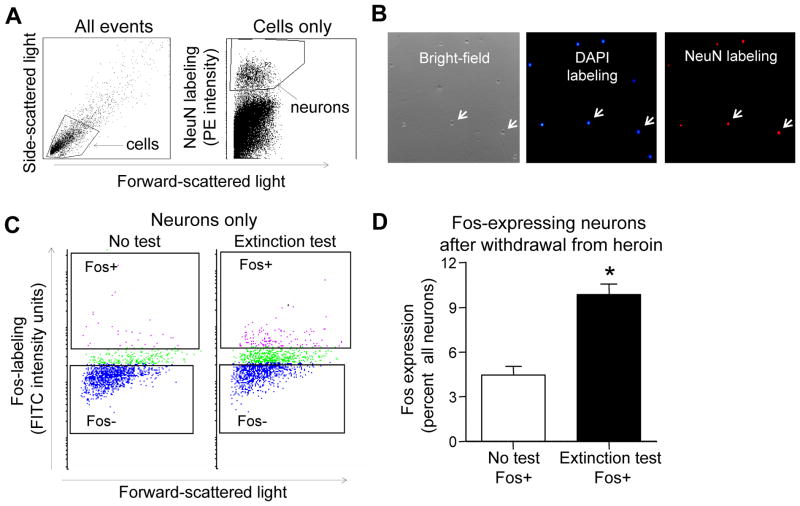
Figure 2. FACS of Fos-labeled neurons from mPFC and OFC after prolonged withdrawal from heroin self-administration.
(A) Left panel: representative light scatter plot in which each dot represents one event (cell or debris). Forward scatter is a measure of size; side scatter is a measure of granularity. The ‘gate’ indicated by the solid-line box encompasses intact cells. Right panel: representative light scatter and fluorescence plot showing only events from the “cells” gate in the left panel scatter plot. Events high on the Y-axis represent neurons. A second gate indicated by the solid-line box labeled “neurons” encompasses all events analyzed on subsequent fluorescence plots. These gates allow selective analysis of neurons and exclusion of other cells and debris. (B) Photomicrographs of FACS-purified cells labeled with DAPI. Left panel: Bright-field image of intact cells indicated by arrows. Middle panel: fluorescence image of blue DAPI-labeling of intact cells indicated by arrows. Right panel: fluorescence image of red NeuN-labeling of neurons indicated by arrows. (C) Representative light scatter and fluorescence plots from the Extinction test and No test rats indicate degree of Fos-labeling of neurons selected by event gates in Figure 3A. Events high and low on the Y-axis represent activated neurons (Fos+) and non-activated neurons (Fos−). (D) Percentage of activated (Fos+) neurons in the Extinction test and No test conditions (mean ± SEM, *p < 0.05, n=3–5 pooled samples (n=46–60 rats) per experimental condition).

